
- Start >
- Rivers >
- Discharge >
- Obere Donau >
- Heroldingen >
- Chart of year

Chart of year Heroldingen / Wörnitz
Discharge from 03.04.2020 to 02.04.2021
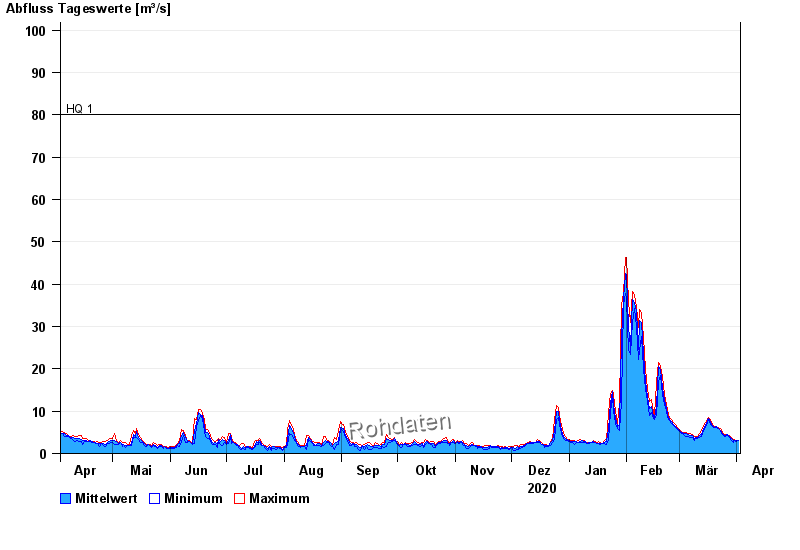
- HQ1 80 m³/s
- HQ2 125 m³/s
- HQ5 180 m³/s
- HQ10 225 m³/s
- HQ20 275 m³/s
- HQ50 345 m³/s
- HQ100 410 m³/s
| Date | Mean value [m³/s] | Maximum [m³/s] | Minimum [m³/s] |
|---|---|---|---|
| 02.04.2021 | 3.04 | 3.13 | 3.01 |
| 01.04.2021 | 2.98 | 3.13 | 2.8 |
| 31.03.2021 | 3.18 | 3.36 | 3.01 |
| 30.03.2021 | 2.97 | 3.36 | 2.59 |
| 29.03.2021 | 3.52 | 3.85 | 3.13 |
| 28.03.2021 | 3.93 | 4.23 | 3.72 |
| 27.03.2021 | 4.39 | 4.5 | 4.23 |
© Bayerisches Landesamt für Umwelt 2024