
- Start >
- Rivers >
- Discharge >
- Obere Donau >
- Heitzenhofen >
- Chart of year

Chart of year Heitzenhofen / Naab
Discharge from 30.03.2024 to 29.03.2025
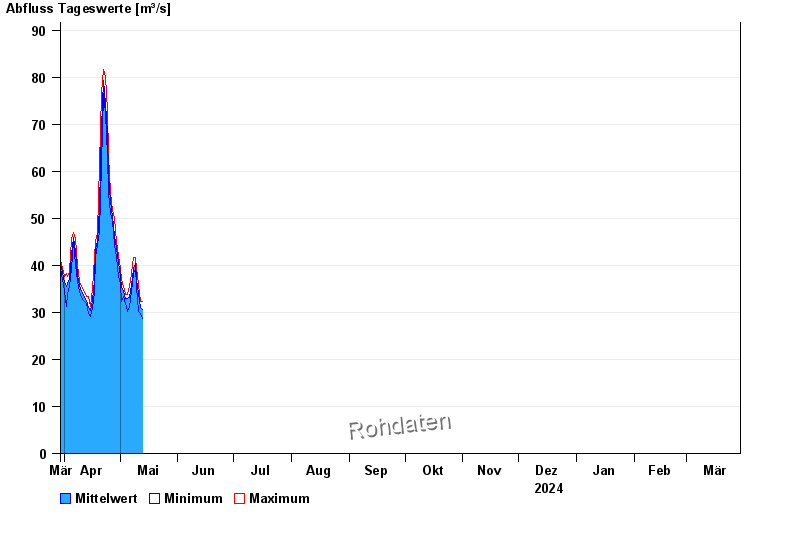
| Date | Mean value [m³/s] | Maximum [m³/s] | Minimum [m³/s] |
|---|---|---|---|
| 14.05.2024 | 29.4 | 30.8 | 27.7 |
| 13.05.2024 | 30.7 | 32.3 | 28.7 |
| 12.05.2024 | 31.1 | 32.3 | 29.7 |
| 11.05.2024 | 34.1 | 36 | 30.2 |
| 10.05.2024 | 37.1 | 39.3 | 35.5 |
| 09.05.2024 | 40.4 | 41.7 | 39.3 |
| 08.05.2024 | 39.4 | 41.7 | 38.3 |
© Bayerisches Landesamt für Umwelt 2024