
- Start >
- Rivers >
- Discharge >
- Obere Donau >
- Haunstetten >
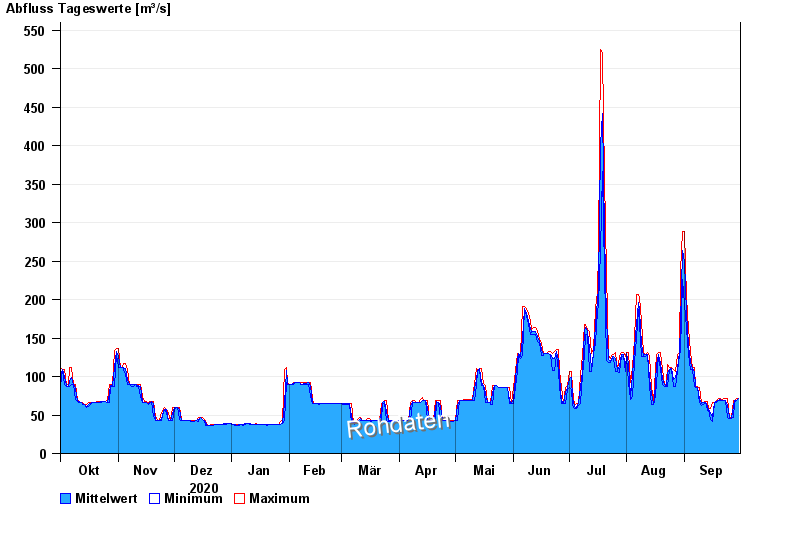
- Chart of year

Chart of year Haunstetten / Lech
Discharge from 01.10.2020 to 30.09.2021
| Date | Mean value [m³/s] | Maximum [m³/s] | Minimum [m³/s] |
|---|---|---|---|
| 30.09.2021 | 71 | 71 | 71 |
| 29.09.2021 | 69.1 | 71 | 68.9 |
| 28.09.2021 | 68.7 | 68.9 | 66.8 |
| 27.09.2021 | 61.7 | 68.9 | 47.3 |
| 26.09.2021 | 45.7 | 47.3 | 45.4 |
| 25.09.2021 | 46.4 | 47.3 | 45.4 |
| 24.09.2021 | 62.8 | 71 | 47.3 |
© Bayerisches Landesamt für Umwelt 2024