
- Start >
- Rivers >
- Discharge >
- Obere Donau >
- Haunstetten >
- Chart of year

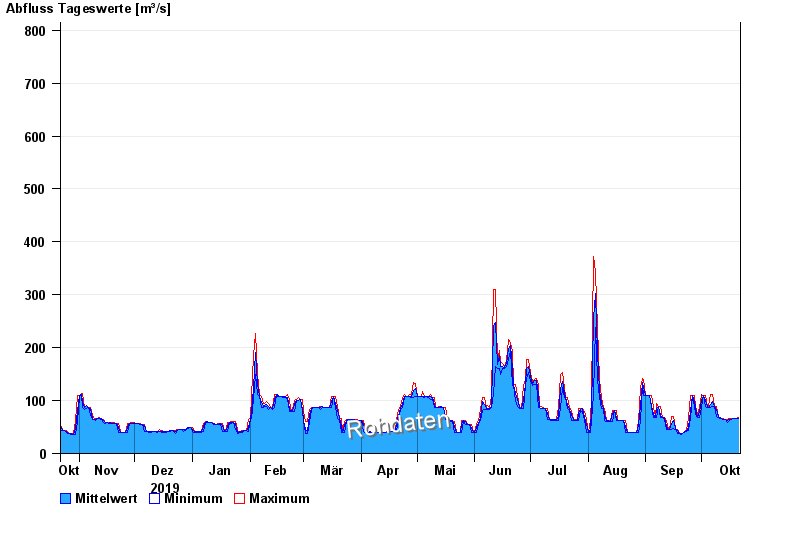
Chart of year Haunstetten / Lech
Discharge from 22.10.2019 to 21.10.2020
 Für diesen Pegel sind keine Jährlichkeiten hinterlegt.
| Date | Mean value [m³/s] | Maximum [m³/s] | Minimum [m³/s] |
|---|---|---|---|
| 21.10.2020 | 66.5 | 67.7 | 65.7 |
| 20.10.2020 | 65.7 | 65.7 | 65.7 |
| 19.10.2020 | 65.7 | 65.7 | 65.7 |
| 18.10.2020 | 65.7 | 65.7 | 65.7 |
| 17.10.2020 | 65.2 | 65.7 | 63.6 |
| 16.10.2020 | 64 | 65.7 | 61.5 |
| 15.10.2020 | 61.5 | 63.6 | 59.5 |
© Bayerisches Landesamt für Umwelt 2024