
- Start >
- Rivers >
- Discharge >
- Obere Donau >
- Haunstetten >
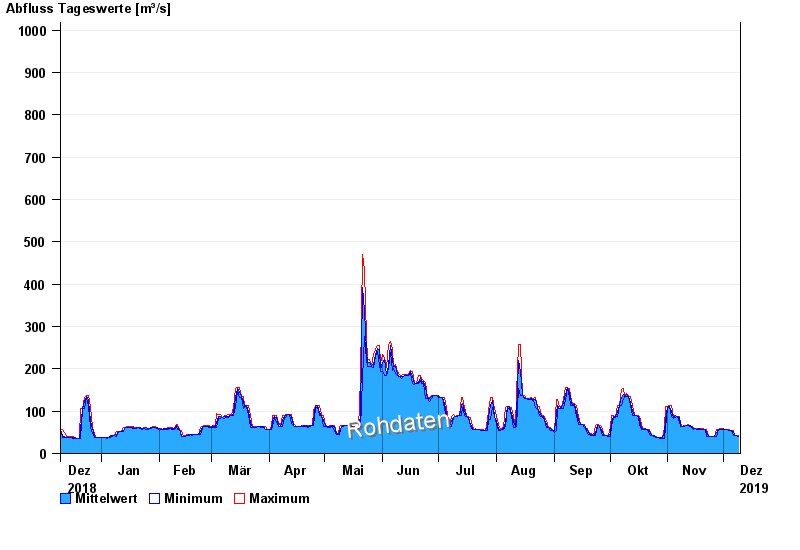
- Chart of year

Chart of year Haunstetten / Lech
Discharge from 10.12.2018 to 09.12.2019
 Für diesen Pegel sind keine Jährlichkeiten hinterlegt.
| Date | Mean value [m³/s] | Maximum [m³/s] | Minimum [m³/s] |
|---|---|---|---|
| 09.12.2019 | 41.2 | 42.1 | 40.4 |
| 08.12.2019 | 42.1 | 42.1 | 42.1 |
| 07.12.2019 | 42.1 | 42.1 | 42.1 |
| 06.12.2019 | 53.1 | 54.6 | 42.1 |
| 05.12.2019 | 54.6 | 54.6 | 54.6 |
| 04.12.2019 | 54.8 | 56.6 | 54.6 |
| 03.12.2019 | 56.6 | 56.6 | 56.6 |
© Bayerisches Landesamt für Umwelt 2024