
- Start >
- Rivers >
- Discharge >
- Obere Donau >
- Hasberg >
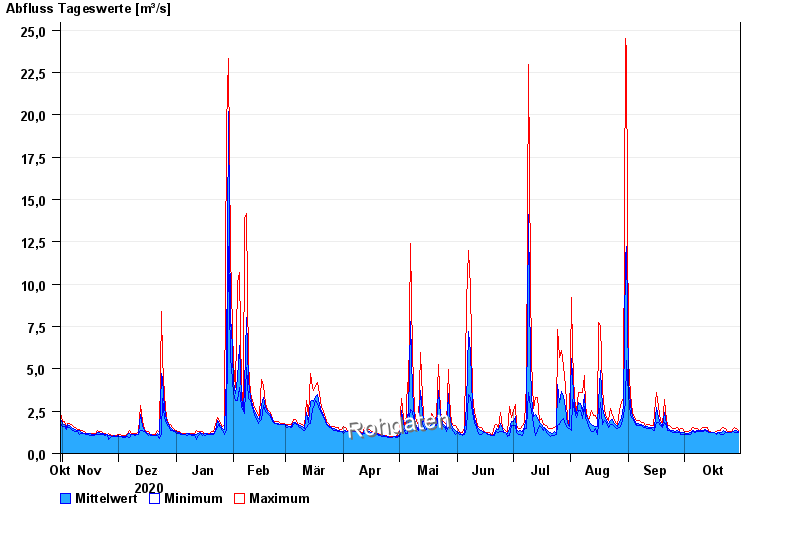
- Chart of year

Chart of year Hasberg / Mindel
Discharge from 31.10.2020 to 30.10.2021
| Date | Mean value [m³/s] | Maximum [m³/s] | Minimum [m³/s] |
|---|---|---|---|
| 30.10.2021 | 1.3 | 1.37 | 1.22 |
| 29.10.2021 | 1.33 | 1.45 | 1.22 |
| 28.10.2021 | 1.35 | 1.54 | 1.22 |
| 27.10.2021 | 1.32 | 1.45 | 1.29 |
| 26.10.2021 | 1.23 | 1.29 | 1.22 |
| 25.10.2021 | 1.24 | 1.29 | 1.22 |
| 24.10.2021 | 1.23 | 1.29 | 1.22 |
© Bayerisches Landesamt für Umwelt 2024