
- Start >
- Rivers >
- Discharge >
- Obere Donau >
- Hasberg >
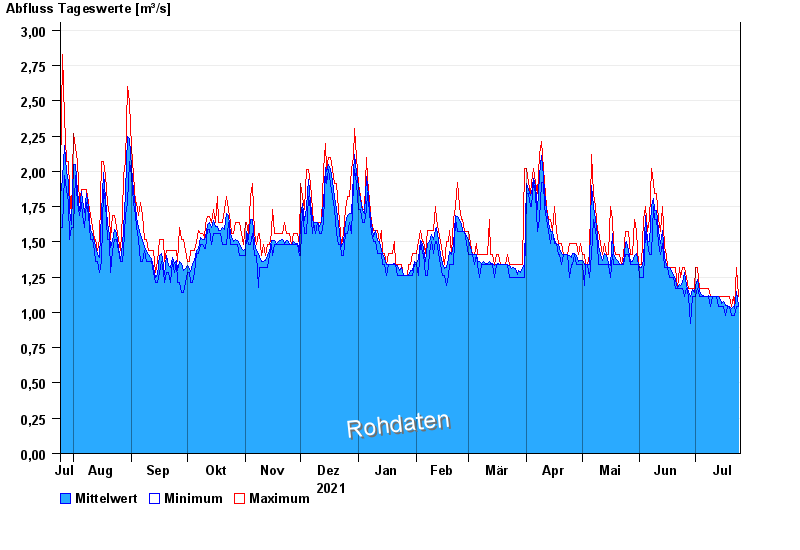
- Chart of year

Chart of year Hasberg / Östliche Mindel
Discharge from 25.07.2021 to 24.07.2022
| Date | Mean value [m³/s] | Maximum [m³/s] | Minimum [m³/s] |
|---|---|---|---|
| 24.07.2022 | 1.05 | 1.11 | 1.04 |
| 23.07.2022 | 1.15 | 1.32 | 1.04 |
| 22.07.2022 | 1.03 | 1.04 | 0.978 |
| 21.07.2022 | 1.04 | 1.11 | 0.978 |
| 20.07.2022 | 1.03 | 1.04 | 0.978 |
| 19.07.2022 | 1.04 | 1.11 | 1.04 |
| 18.07.2022 | 1.05 | 1.11 | 1.04 |
© Bayerisches Landesamt für Umwelt 2024