
- Start >
- Rivers >
- Discharge >
- Obere Donau >
- Hasberg >
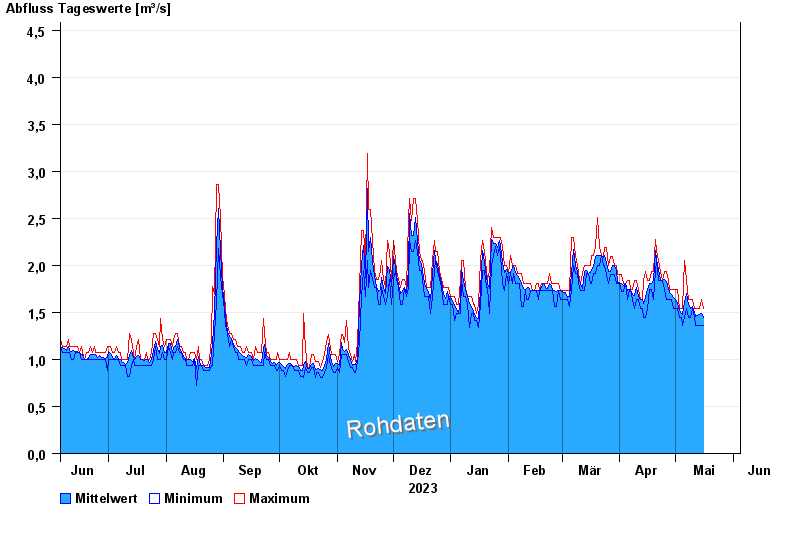
- Chart of year

Chart of year Hasberg / Östliche Mindel
Discharge from 05.06.2023 to 04.06.2024
- 07.06.2002 Abfluss: 13,7 m³/s
- 22.09.1968 Abfluss: 11,1 m³/s
- 11.06.1965 Abfluss: 10,9 m³/s
- 08.06.1971 Abfluss: 10,8 m³/s
- 24.07.1966 Abfluss: 10,7 m³/s
| Date | Mean value [m³/s] | Maximum [m³/s] | Minimum [m³/s] |
|---|---|---|---|
| 29.04.2024 | 1.69 | 1.74 | 1.64 |
| 28.04.2024 | 1.71 | 1.74 | 1.64 |
| 27.04.2024 | 1.75 | 1.84 | 1.64 |
| 26.04.2024 | 1.83 | 1.94 | 1.64 |
| 25.04.2024 | 1.85 | 1.94 | 1.74 |
| 24.04.2024 | 1.84 | 1.84 | 1.84 |
| 23.04.2024 | 1.85 | 1.94 | 1.84 |
© Bayerisches Landesamt für Umwelt 2024