
- Start >
- Rivers >
- Discharge >
- Obere Donau >
- Harburg >
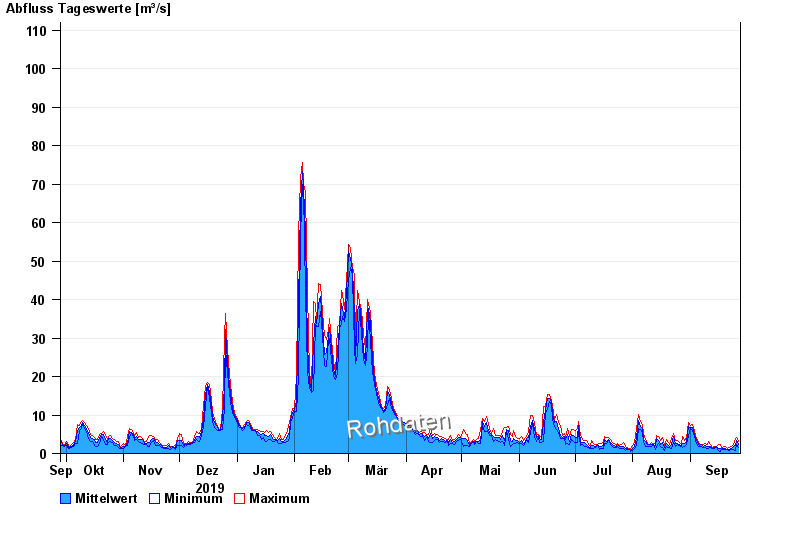
- Chart of year

Chart of year Harburg / Wörnitz
Discharge from 28.09.2019 to 27.09.2020
- 21.12.1993 Abfluss: 444 m³/s
- 14.04.1994 Abfluss: 435 m³/s
- 23.02.1970 Abfluss: 367 m³/s
- 17.03.1988 Abfluss: 319 m³/s
- 04.03.1956 Abfluss: 296 m³/s
| Date | Mean value [m³/s] | Maximum [m³/s] | Minimum [m³/s] |
|---|---|---|---|
| 27.09.2020 | 2.32 | 3.07 | 1.48 |
| 26.09.2020 | 3.48 | 4.14 | 2.45 |
| 25.09.2020 | 2.05 | 3.92 | 0.786 |
| 24.09.2020 | 1.78 | 2.45 | 1.04 |
| 23.09.2020 | 1.33 | 1.75 | 0.948 |
| 22.09.2020 | 1.04 | 1.48 | 0.862 |
| 21.09.2020 | 1.08 | 1.24 | 0.948 |
© Bayerisches Landesamt für Umwelt 2024