
- Start >
- Rivers >
- Discharge >
- Obere Donau >
- Harburg >
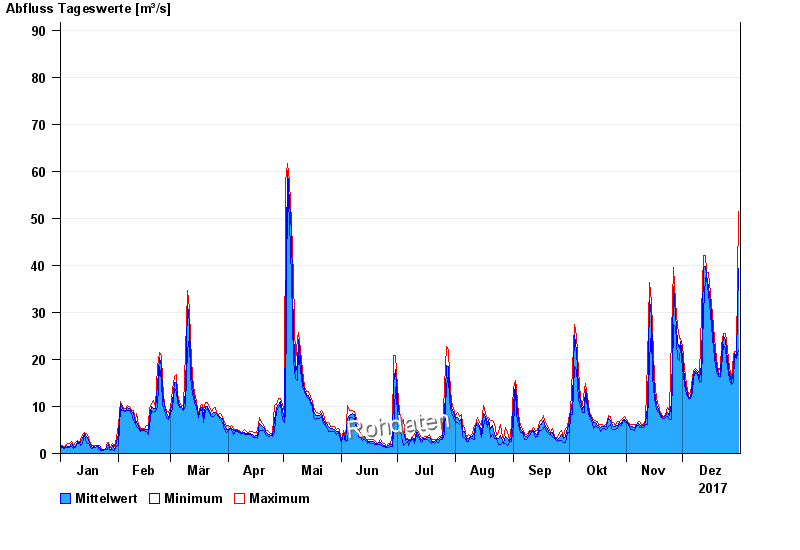
- Chart of year

Chart of year Harburg / Wörnitz
Discharge from 01.01.2017 to 31.12.2017
- 21.12.1993 Abfluss: 444 m³/s
- 14.04.1994 Abfluss: 435 m³/s
- 23.02.1970 Abfluss: 367 m³/s
- 17.03.1988 Abfluss: 319 m³/s
- 04.03.1956 Abfluss: 296 m³/s
| Date | Mean value [m³/s] | Maximum [m³/s] | Minimum [m³/s] |
|---|---|---|---|
| 31.12.2017 | 39.3 | 51.5 | 21.9 |
| 30.12.2017 | 20.4 | 21.6 | 20.1 |
| 29.12.2017 | 21.3 | 21.6 | 20.9 |
| 28.12.2017 | 17.8 | 20.9 | 15.1 |
| 27.12.2017 | 15.1 | 15.7 | 14.6 |
| 26.12.2017 | 16.9 | 18.3 | 15.7 |
| 25.12.2017 | 20 | 22.2 | 18.3 |
© Bayerisches Landesamt für Umwelt 2024