
- Start >
- Rivers >
- Discharge >
- Obere Donau >
- Grafrath >
- Chart of year

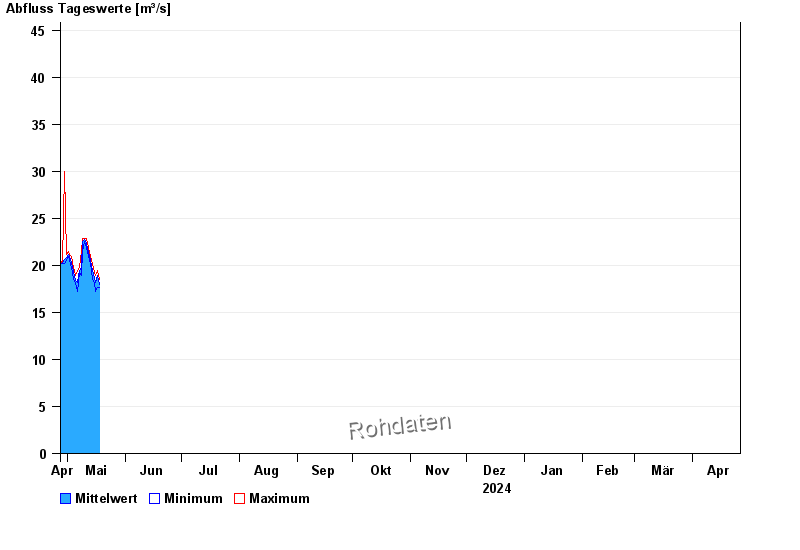
Chart of year Grafrath / Amper
Discharge from 27.04.2024 to 26.04.2025
- 24.05.1999 Abfluss: 167 m³/s
- 12.06.1965 Abfluss: 140 m³/s
- 21.06.1979 Abfluss: 106 m³/s
- 02.06.1965 Abfluss: 94,3 m³/s
- 05.06.2013 Abfluss: 89,2 m³/s
| Date | Mean value [m³/s] | Maximum [m³/s] | Minimum [m³/s] |
|---|---|---|---|
| 05.05.2024 | 18.5 | 18.9 | 18.2 |
| 04.05.2024 | 19.3 | 19.8 | 18.5 |
| 03.05.2024 | 20.3 | 20.9 | 19.8 |
| 02.05.2024 | 20.9 | 21.2 | 20.5 |
| 01.05.2024 | 21.2 | 21.5 | 20.9 |
| 30.04.2024 | 20.8 | 21.2 | 20.5 |
| 29.04.2024 | 20.6 | 30 | 20.2 |
© Bayerisches Landesamt für Umwelt 2024