
- Start >
- Rivers >
- Discharge >
- Obere Donau >
- Grafrath >
- Chart of year

Chart of year Grafrath / Amper
Discharge from 30.03.2024 to 29.03.2025
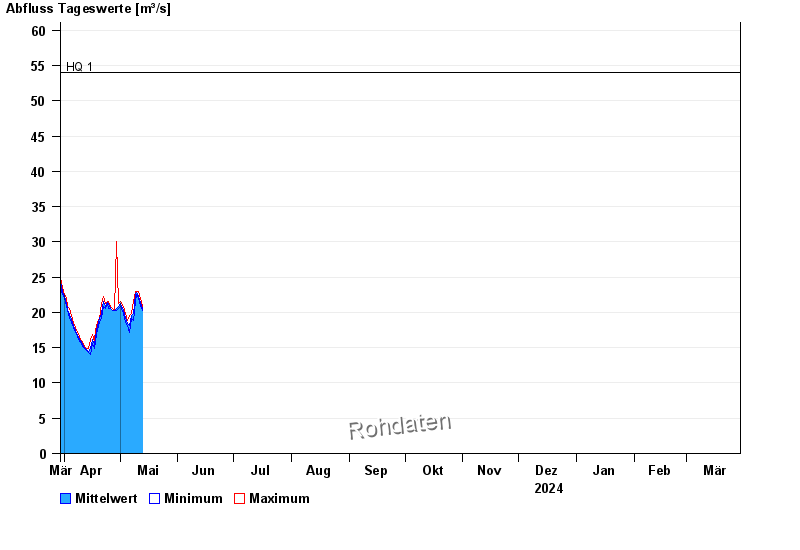
- HQ1 54 m³/s
- HQ2 62 m³/s
- HQ5 72 m³/s
- HQ10 86 m³/s
- HQ20 102 m³/s
- HQ50 125 m³/s
- HQ100 145 m³/s
| Date | Mean value [m³/s] | Maximum [m³/s] | Minimum [m³/s] |
|---|---|---|---|
| 15.05.2024 | 18.5 | 18.5 | 18.2 |
| 14.05.2024 | 19.5 | 20.2 | 18.5 |
| 13.05.2024 | 20.5 | 20.9 | 20.2 |
| 12.05.2024 | 21.4 | 21.9 | 20.9 |
| 11.05.2024 | 22.3 | 22.9 | 21.9 |
| 10.05.2024 | 22.8 | 22.9 | 22.5 |
| 09.05.2024 | 22.5 | 22.9 | 21.5 |
© Bayerisches Landesamt für Umwelt 2024