
- Start >
- Rivers >
- Discharge >
- Obere Donau >
- Fürstenfeldbruck >
- Chart of year

Chart of year Fürstenfeldbruck / Amper
Discharge from 01.01.2023 to 31.12.2023
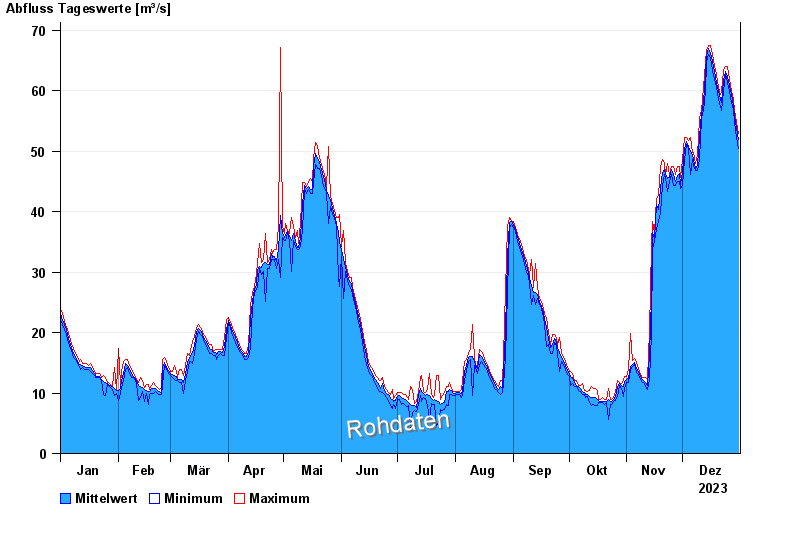
| Date | Mean value [m³/s] | Maximum [m³/s] | Minimum [m³/s] |
|---|---|---|---|
| 31.12.2023 | 53.7 | 55 | 52.5 |
| 30.12.2023 | 55.5 | 56.7 | 54.2 |
| 29.12.2023 | 57.5 | 58.4 | 56.3 |
| 28.12.2023 | 59.3 | 60.4 | 58.3 |
| 27.12.2023 | 61 | 61.9 | 59.9 |
| 26.12.2023 | 62.5 | 63.6 | 61.7 |
| 25.12.2023 | 64.1 | 65.7 | 63 |
© Bayerisches Landesamt für Umwelt 2025