
- Start >
- Rivers >
- Discharge >
- Obere Donau >
- Freising >
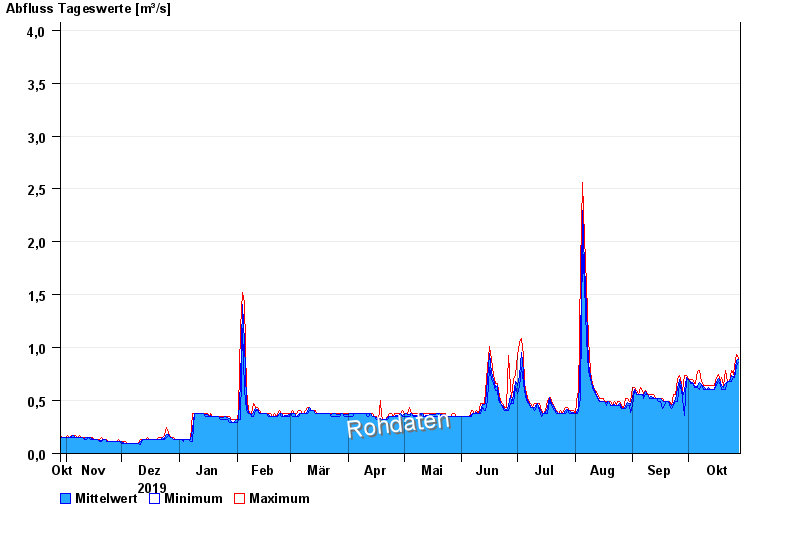
- Chart of year

Chart of year Freising / Schleifermoosach
Discharge from 29.10.2019 to 28.10.2020
- 02.06.2013 Abfluss: 16,1 m³/s
- 24.08.2005 Abfluss: 10,9 m³/s
- 23.05.1999 Abfluss: 9,37 m³/s
- 12.08.2002 Abfluss: 8,15 m³/s
- 02.06.1995 Abfluss: 7,97 m³/s
| Date | Mean value [m³/s] | Maximum [m³/s] | Minimum [m³/s] |
|---|---|---|---|
| 28.10.2020 | 0.884 | 0.896 | 0.859 |
| 27.10.2020 | 0.883 | 0.933 | 0.822 |
| 26.10.2020 | 0.725 | 0.822 | 0.714 |
| 25.10.2020 | 0.731 | 0.749 | 0.714 |
| 24.10.2020 | 0.741 | 0.786 | 0.678 |
| 23.10.2020 | 0.678 | 0.678 | 0.678 |
| 22.10.2020 | 0.678 | 0.678 | 0.678 |
© Bayerisches Landesamt für Umwelt 2024