
- Start >
- Rivers >
- Discharge >
- Obere Donau >
- Freising >
- Chart of year

Chart of year Freising / Moosach
Discharge from 28.11.2021 to 27.11.2022
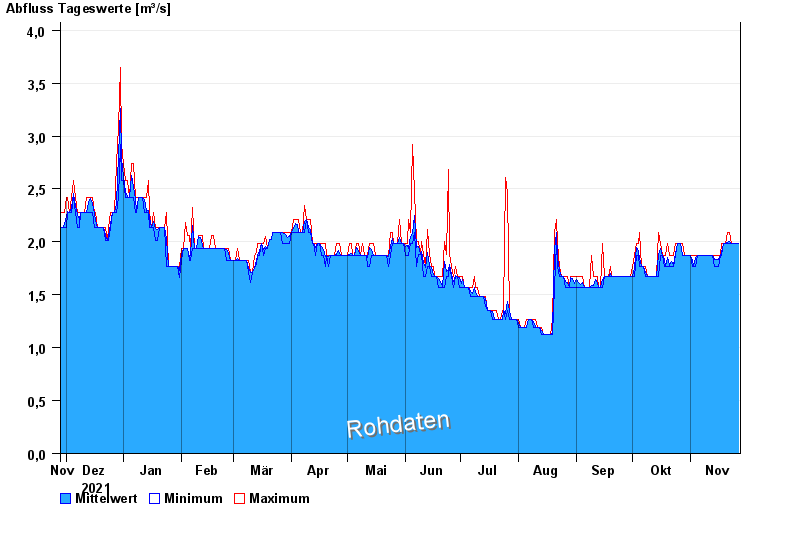
| Date | Mean value [m³/s] | Maximum [m³/s] | Minimum [m³/s] |
|---|---|---|---|
| 27.11.2022 | 1.98 | 1.98 | 1.98 |
| 26.11.2022 | 1.98 | 1.98 | 1.98 |
| 25.11.2022 | 1.98 | 1.98 | 1.98 |
| 24.11.2022 | 1.98 | 1.98 | 1.98 |
| 23.11.2022 | 1.98 | 1.98 | 1.98 |
| 22.11.2022 | 2 | 2.09 | 1.98 |
| 21.11.2022 | 1.99 | 2.09 | 1.98 |
© Bayerisches Landesamt für Umwelt 2024