
- Start >
- Rivers >
- Discharge >
- Obere Donau >
- Freising >
- Chart of year

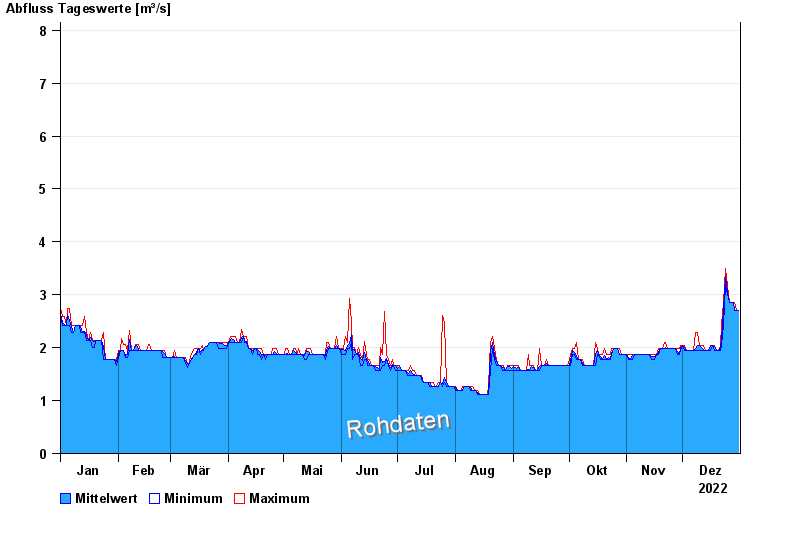
Chart of year Freising / Moosach
Discharge from 01.01.2022 to 31.12.2022
 Für diesen Pegel sind keine Jährlichkeiten hinterlegt.
| Date | Mean value [m³/s] | Maximum [m³/s] | Minimum [m³/s] |
|---|---|---|---|
| 31.12.2022 | 2.71 | 2.71 | 2.71 |
| 30.12.2022 | 2.71 | 2.71 | 2.71 |
| 29.12.2022 | 2.73 | 2.86 | 2.71 |
| 28.12.2022 | 2.86 | 2.86 | 2.86 |
| 27.12.2022 | 2.86 | 2.86 | 2.86 |
| 26.12.2022 | 2.86 | 2.86 | 2.86 |
| 25.12.2022 | 3.05 | 3.17 | 3 |
© Bayerisches Landesamt für Umwelt 2024