
- Start >
- Rivers >
- Discharge >
- Obere Donau >
- Freising >
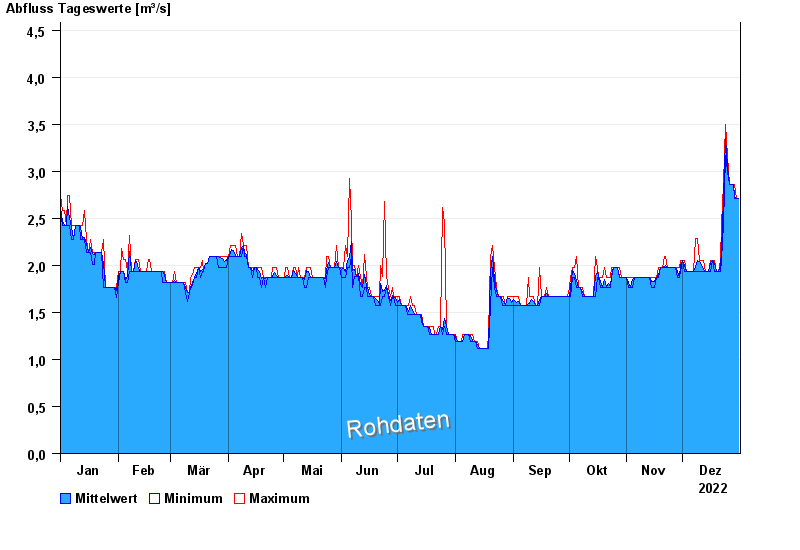
- Chart of year

Chart of year Freising / Moosach
Discharge from 01.01.2022 to 31.12.2022
- 02.06.2013 Abfluss: 11,8 m³/s
- 23.06.1992 Abfluss: 9,24 m³/s
- 31.07.1990 Abfluss: 7,71 m³/s
- 02.02.2013 Abfluss: 7,69 m³/s
- 15.02.1990 Abfluss: 7,36 m³/s
| Date | Mean value [m³/s] | Maximum [m³/s] | Minimum [m³/s] |
|---|---|---|---|
| 31.12.2022 | 2.71 | 2.71 | 2.71 |
| 30.12.2022 | 2.71 | 2.71 | 2.71 |
| 29.12.2022 | 2.73 | 2.86 | 2.71 |
| 28.12.2022 | 2.86 | 2.86 | 2.86 |
| 27.12.2022 | 2.86 | 2.86 | 2.86 |
| 26.12.2022 | 2.86 | 2.86 | 2.86 |
| 25.12.2022 | 3.05 | 3.17 | 3 |
© Bayerisches Landesamt für Umwelt 2024