
- Start >
- Rivers >
- Discharge >
- Obere Donau >
- Freising >
- Chart of year

Chart of year Freising / Isar
Discharge from 21.10.2021 to 20.10.2022
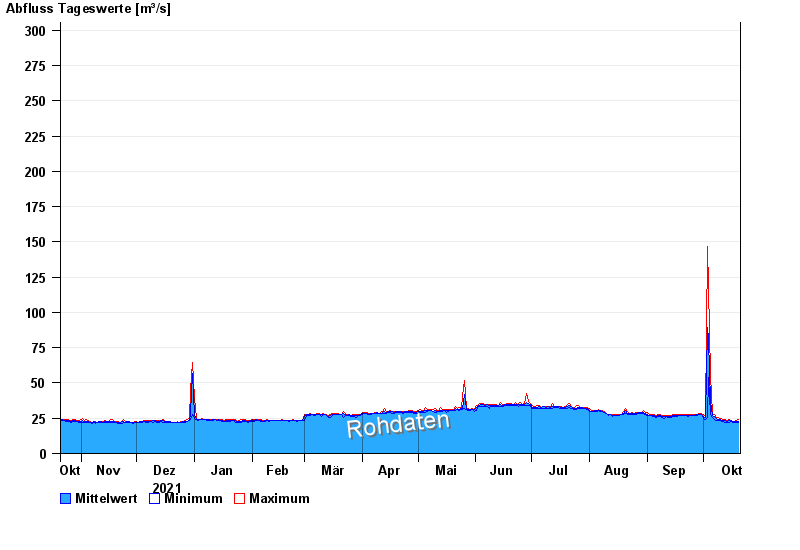
- HQ5 550 m³/s
- HQ10 650 m³/s
- HQ20 750 m³/s
- HQ100 1050 m³/s
| Date | Mean value [m³/s] | Maximum [m³/s] | Minimum [m³/s] |
|---|---|---|---|
| 20.10.2022 | 22.8 | 23.9 | 22.3 |
| 19.10.2022 | 22.8 | 23.3 | 22.3 |
| 18.10.2022 | 22.5 | 22.8 | 21.8 |
| 17.10.2022 | 22.8 | 22.8 | 22.3 |
| 16.10.2022 | 23.2 | 23.3 | 22.8 |
| 15.10.2022 | 23.2 | 23.9 | 22.3 |
| 14.10.2022 | 22.7 | 23.3 | 21.8 |
© Bayerisches Landesamt für Umwelt 2024