
- Start >
- Rivers >
- Discharge >
- Obere Donau >
- Freising >
- Chart of year

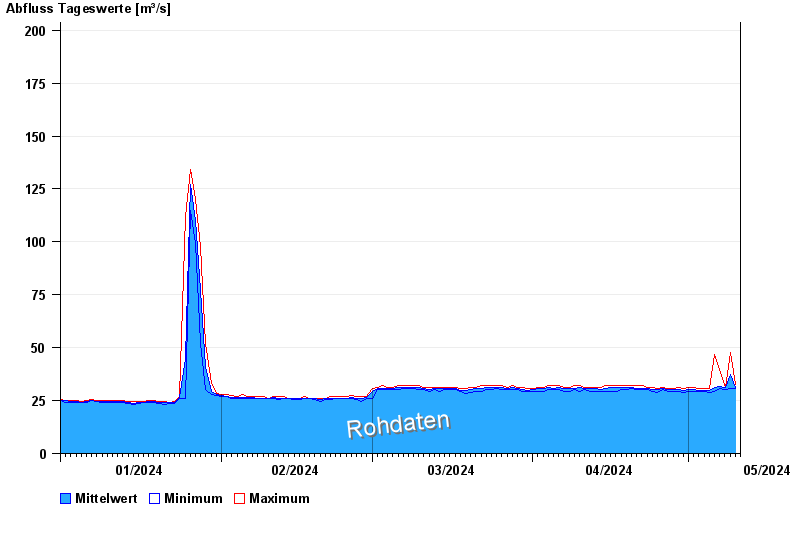
Chart of year Freising / Isar
Discharge from 01.01.2024 to 10.05.2024
- 10.07.1954 Abfluss: 1050 m³/s
- 24.08.2005 Abfluss: 916 m³/s
- 09.07.1955 Abfluss: 735 m³/s
- 01.06.1965 Abfluss: 658 m³/s
- 23.05.1999 Abfluss: 649 m³/s
| Date | Mean value [m³/s] | Maximum [m³/s] | Minimum [m³/s] |
|---|---|---|---|
| 10.05.2024 | 31.9 | 32.5 | 30.7 |
| 09.05.2024 | 37.5 | 47.7 | 30.7 |
| 08.05.2024 | 31.1 | 31.3 | 30.1 |
| 07.05.2024 | 31.7 | 39.9 | 30.7 |
| 06.05.2024 | 31.2 | 46.8 | 29.5 |
| 05.05.2024 | 29.9 | 30.7 | 28.9 |
| 04.05.2024 | 30 | 30.7 | 29.5 |
© Bayerisches Landesamt für Umwelt 2024