
- Start >
- Rivers >
- Discharge >
- Obere Donau >
- Fischach >
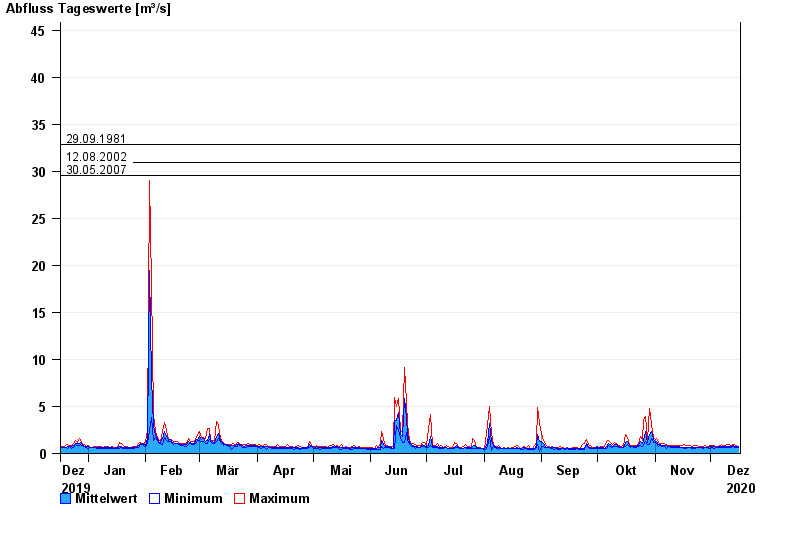
- Chart of year

Chart of year Fischach / Schmutter
Discharge from 17.12.2019 to 16.12.2020
- 22.08.2005 Abfluss: 126 m³/s
- 31.07.1977 Abfluss: 70,8 m³/s
- 29.09.1981 Abfluss: 32,8 m³/s
- 12.08.2002 Abfluss: 30,9 m³/s
- 30.05.2007 Abfluss: 29,6 m³/s
| Date | Mean value [m³/s] | Maximum [m³/s] | Minimum [m³/s] |
|---|---|---|---|
| 16.12.2020 | 0.692 | 0.744 | 0.638 |
| 15.12.2020 | 0.728 | 0.858 | 0.638 |
| 14.12.2020 | 0.787 | 0.978 | 0.69 |
| 13.12.2020 | 0.841 | 0.917 | 0.744 |
| 12.12.2020 | 0.735 | 0.8 | 0.689 |
| 11.12.2020 | 0.743 | 0.915 | 0.689 |
| 10.12.2020 | 0.743 | 0.976 | 0.636 |
© Bayerisches Landesamt für Umwelt 2024