
- Start >
- Rivers >
- Discharge >
- Obere Donau >
- Fischach >
- Chart of year

Chart of year Fischach / Schmutter
Discharge from 16.09.2019 to 15.09.2020
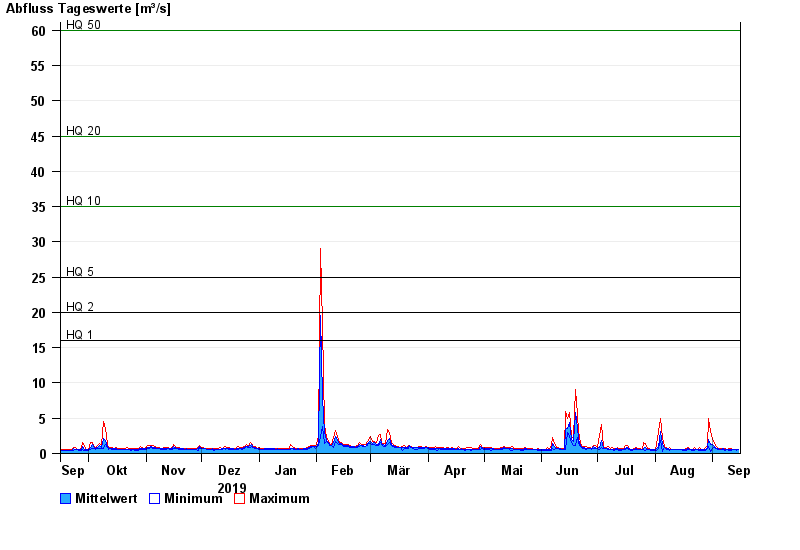
- HQ1 16 m³/s
- HQ2 20 m³/s
- HQ5 25 m³/s
- HQ10 35 m³/s
- HQ20 45 m³/s
- HQ50 60 m³/s
- HQ100 75 m³/s
| Date | Mean value [m³/s] | Maximum [m³/s] | Minimum [m³/s] |
|---|---|---|---|
| 15.09.2020 | 0.537 | 0.614 | 0.516 |
| 14.09.2020 | 0.521 | 0.564 | 0.471 |
| 13.09.2020 | 0.541 | 0.614 | 0.517 |
| 12.09.2020 | 0.55 | 0.615 | 0.517 |
| 11.09.2020 | 0.563 | 0.776 | 0.428 |
| 10.09.2020 | 0.566 | 0.667 | 0.472 |
| 09.09.2020 | 0.6 | 0.616 | 0.566 |
© Bayerisches Landesamt für Umwelt 2024