
- Start >
- Rivers >
- Discharge >
- Obere Donau >
- Fischach >
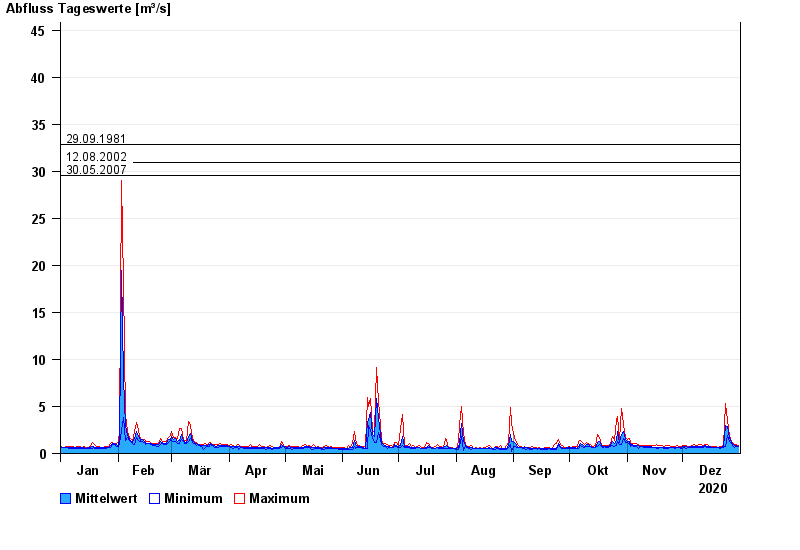
- Chart of year

Chart of year Fischach / Schmutter
Discharge from 01.01.2020 to 31.12.2020
- 22.08.2005 Abfluss: 126 m³/s
- 31.07.1977 Abfluss: 70,8 m³/s
- 29.09.1981 Abfluss: 32,8 m³/s
- 12.08.2002 Abfluss: 30,9 m³/s
- 30.05.2007 Abfluss: 29,6 m³/s
| Date | Mean value [m³/s] | Maximum [m³/s] | Minimum [m³/s] |
|---|---|---|---|
| 31.12.2020 | 0.773 | 0.898 | 0.726 |
| 30.12.2020 | 0.841 | 0.959 | 0.782 |
| 29.12.2020 | 0.873 | 0.959 | 0.672 |
| 28.12.2020 | 0.96 | 1.08 | 0.782 |
| 27.12.2020 | 1.14 | 1.28 | 1.02 |
| 26.12.2020 | 1.57 | 1.87 | 1.28 |
| 25.12.2020 | 2.85 | 3.5 | 1.87 |
© Bayerisches Landesamt für Umwelt 2024