
- Start >
- Rivers >
- Discharge >
- Obere Donau >
- Fischach >
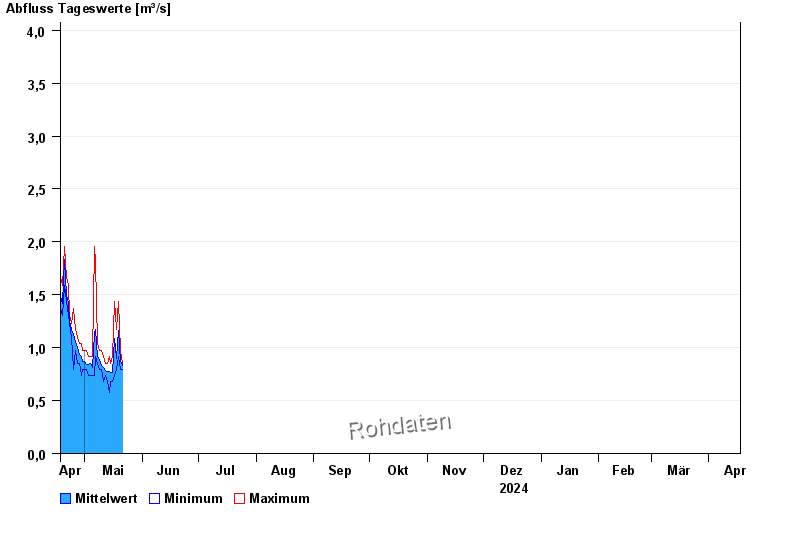
- Chart of year

Chart of year Fischach / Schmutter
Discharge from 18.04.2024 to 17.04.2025
- HQ1 16 m³/s
- HQ2 20 m³/s
- HQ5 25 m³/s
- HQ10 35 m³/s
- HQ20 45 m³/s
- HQ50 60 m³/s
- HQ100 75 m³/s
| Date | Mean value [m³/s] | Maximum [m³/s] | Minimum [m³/s] |
|---|---|---|---|
| 30.04.2024 | 0.853 | 0.913 | 0.79 |
| 29.04.2024 | 0.913 | 1.04 | 0.736 |
| 28.04.2024 | 0.94 | 1.04 | 0.851 |
| 27.04.2024 | 0.998 | 1.1 | 0.851 |
| 26.04.2024 | 1.06 | 1.17 | 0.971 |
| 25.04.2024 | 1.12 | 1.37 | 0.79 |
| 24.04.2024 | 1.17 | 1.23 | 1.1 |
© Bayerisches Landesamt für Umwelt 2024