
- Start >
- Rivers >
- Discharge >
- Obere Donau >
- Fischach >
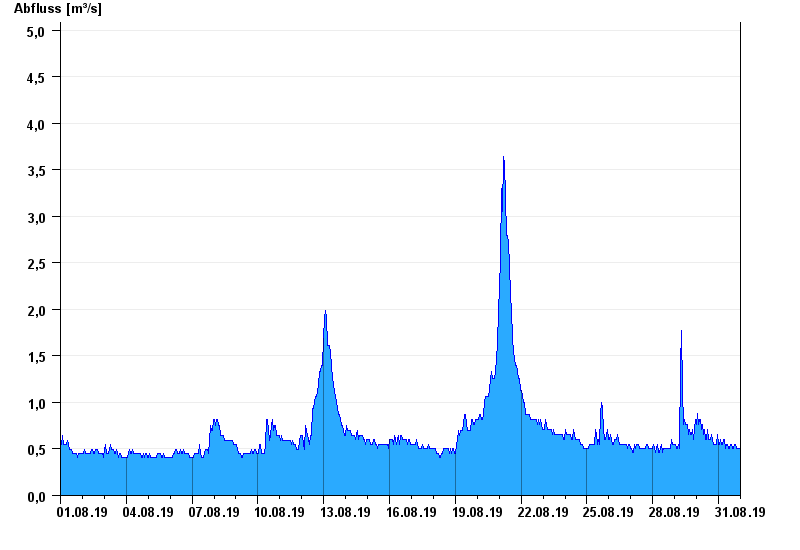
- Chart of month

Chart of month Fischach / Schmutter
Discharge from 01.08.2019 to 31.08.2019
- 22.08.2005 Abfluss: 126 m³/s
- 31.07.1977 Abfluss: 70,8 m³/s
- 29.09.1981 Abfluss: 32,8 m³/s
- 12.08.2002 Abfluss: 30,9 m³/s
- 30.05.2007 Abfluss: 29,6 m³/s
| Date | Runoff [m³/s] |
|---|---|
| 01.09.2019 00:45 | 0.504 |
| 01.09.2019 00:30 | 0.504 |
| 01.09.2019 00:15 | 0.552 |
| 01.09.2019 00:00 | 0.552 |
| 31.08.2019 23:45 | 0.504 |
| 31.08.2019 23:30 | 0.504 |
| 31.08.2019 23:15 | 0.504 |
© Bayerisches Landesamt für Umwelt 2024