
- Start >
- Rivers >
- Discharge >
- Obere Donau >
- Eichstätt >
- Chart of year

Chart of year Eichstätt / Altmühl
Discharge from 01.01.2018 to 31.12.2018
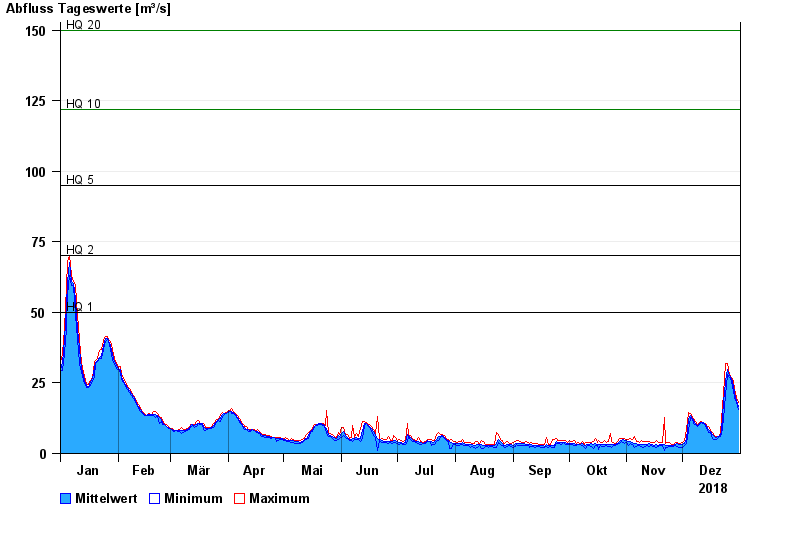
- HQ1 50 m³/s
- HQ2 70 m³/s
- HQ5 95 m³/s
- HQ10 122 m³/s
- HQ20 150 m³/s
- HQ50 185 m³/s
- HQ100 220 m³/s
| Date | Mean value [m³/s] | Maximum [m³/s] | Minimum [m³/s] |
|---|---|---|---|
| 31.12.2018 | 16.8 | 18 | 15.7 |
| 30.12.2018 | 18.9 | 20 | 18 |
| 29.12.2018 | 21.3 | 22.8 | 20 |
| 28.12.2018 | 24.1 | 25.4 | 22 |
| 27.12.2018 | 26.4 | 27.1 | 25.4 |
| 26.12.2018 | 27.6 | 27.9 | 27.1 |
| 25.12.2018 | 29.7 | 31.9 | 27.9 |
© Bayerisches Landesamt für Umwelt 2024