
- Start >
- Rivers >
- Discharge >
- Obere Donau >
- Eichstätt >
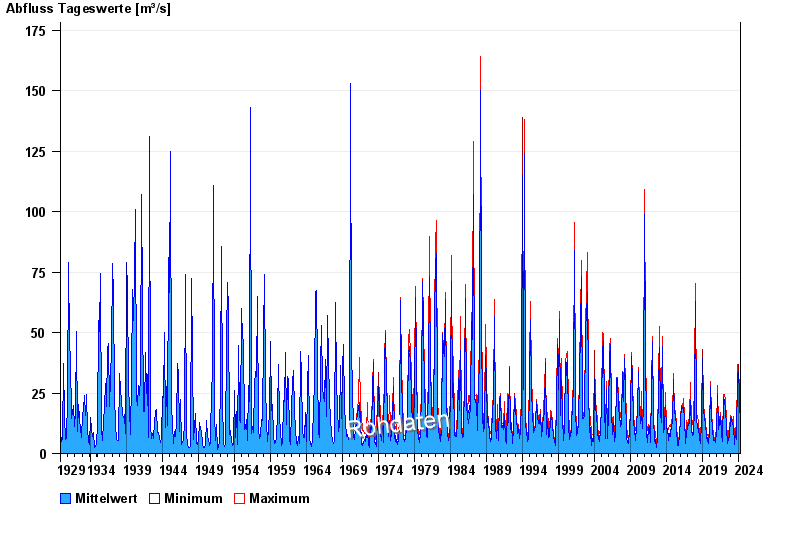
- Chart of total period

Chart of total period Eichstätt / Altmühl
Discharge from 01.11.1929 to 27.04.2024
| Date | Mean value [m³/s] | Maximum [m³/s] | Minimum [m³/s] |
|---|---|---|---|
| 27.04.2024 | 7.16 | 7.18 | 6.98 |
| 26.04.2024 | 7.32 | 7.39 | 7.18 |
| 25.04.2024 | 7.5 | 7.78 | 7.39 |
| 24.04.2024 | 7.45 | 7.59 | 7.39 |
| 23.04.2024 | 7.41 | 7.59 | 7.39 |
| 22.04.2024 | 7.53 | 7.78 | 7.39 |
| 21.04.2024 | 7.27 | 7.59 | 6.79 |
© Bayerisches Landesamt für Umwelt 2024