
- Start >
- Rivers >
- Discharge >
- Obere Donau >
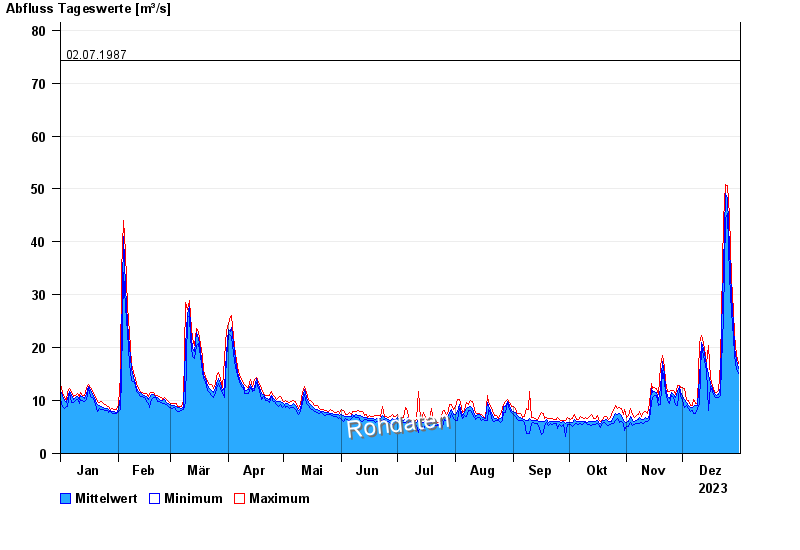
- Dietldorf >
- Chart of year

Chart of year Dietldorf / Vils
Discharge from 01.01.2023 to 31.12.2023
- 23.02.1970 Abfluss: 96,5 m³/s
- 14.01.2011 Abfluss: 85,4 m³/s
- 04.06.2013 Abfluss: 83,9 m³/s
- 03.01.2003 Abfluss: 81,5 m³/s
- 02.07.1987 Abfluss: 74,2 m³/s
| Date | Mean value [m³/s] | Maximum [m³/s] | Minimum [m³/s] |
|---|---|---|---|
| 31.12.2023 | 16 | 17.1 | 15.2 |
| 30.12.2023 | 17.5 | 18.8 | 15.9 |
| 29.12.2023 | 20.1 | 22.3 | 18.6 |
| 28.12.2023 | 24.4 | 26.8 | 22 |
| 27.12.2023 | 29.7 | 33.1 | 26.8 |
| 26.12.2023 | 38.8 | 45 | 33.4 |
| 25.12.2023 | 48.2 | 50.7 | 45.3 |
© Bayerisches Landesamt für Umwelt 2024