
- Start >
- Rivers >
- Discharge >
- Obere Donau >
- Bockenfeld >
- Chart of year

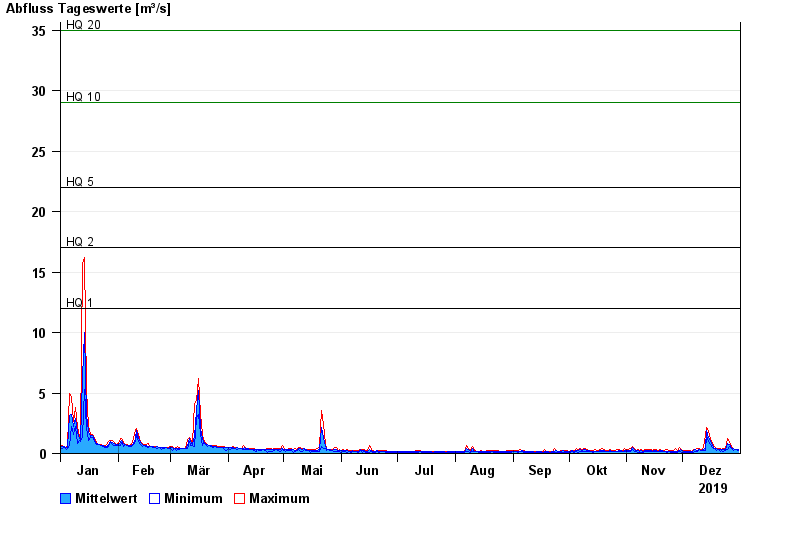
Chart of year Bockenfeld / Tauber
Discharge from 01.01.2019 to 31.12.2019
note
Wasserstand und Abfluss wird zeitweise durch Biberdamm beeinflusst.
- HQ1 12 m³/s
- HQ2 17 m³/s
- HQ5 22 m³/s
- HQ10 29 m³/s
- HQ20 35 m³/s
- HQ50 44 m³/s
- HQ100 54 m³/s
| Date | Mean value [m³/s] | Maximum [m³/s] | Minimum [m³/s] |
|---|---|---|---|
| 31.12.2019 | 0.299 | 0.318 | 0.26 |
| 30.12.2019 | 0.327 | 0.328 | 0.318 |
| 29.12.2019 | 0.348 | 0.37 | 0.328 |
| 28.12.2019 | 0.393 | 0.426 | 0.289 |
| 27.12.2019 | 0.495 | 0.585 | 0.426 |
| 26.12.2019 | 0.746 | 0.97 | 0.585 |
| 25.12.2019 | 0.799 | 1.2 | 0.361 |
© Bayerisches Landesamt für Umwelt 2024