
- Start >
- Rivers >
- Discharge >
- Obere Donau >
- Bockenfeld >
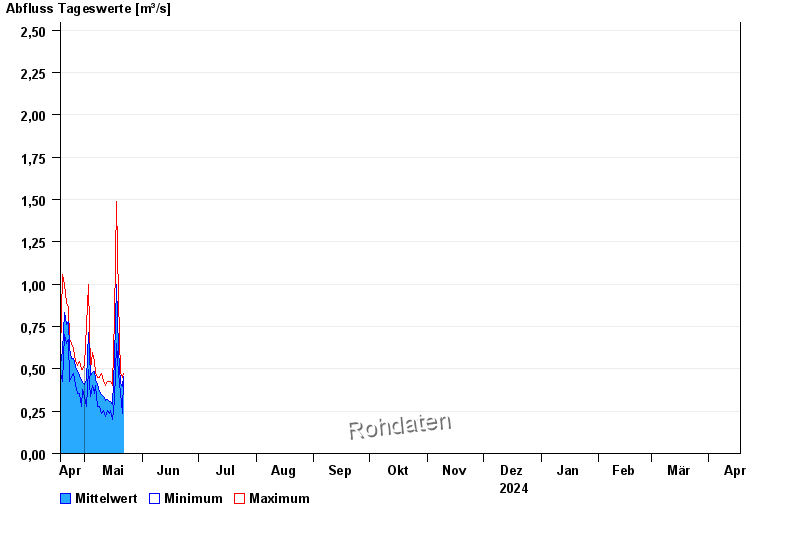
- Chart of year

Chart of year Bockenfeld / Tauber
Discharge from 18.04.2024 to 17.04.2025
note
Wasserstand und Abfluss wird zeitweise durch Biberdamm beeinflusst.
- HQ1 12 m³/s
- HQ2 17 m³/s
- HQ5 22 m³/s
- HQ10 29 m³/s
- HQ20 35 m³/s
- HQ50 44 m³/s
- HQ100 54 m³/s
| Date | Mean value [m³/s] | Maximum [m³/s] | Minimum [m³/s] |
|---|---|---|---|
| 30.04.2024 | 0.423 | 0.495 | 0.4 |
| 29.04.2024 | 0.431 | 0.495 | 0.275 |
| 28.04.2024 | 0.459 | 0.545 | 0.357 |
| 27.04.2024 | 0.483 | 0.519 | 0.357 |
| 26.04.2024 | 0.511 | 0.545 | 0.4 |
| 25.04.2024 | 0.564 | 0.623 | 0.47 |
| 24.04.2024 | 0.563 | 0.649 | 0.446 |
© Bayerisches Landesamt für Umwelt 2024