
- Start >
- Rivers >
- Discharge >
- Obere Donau >
- Blumenthal >
- Chart of year

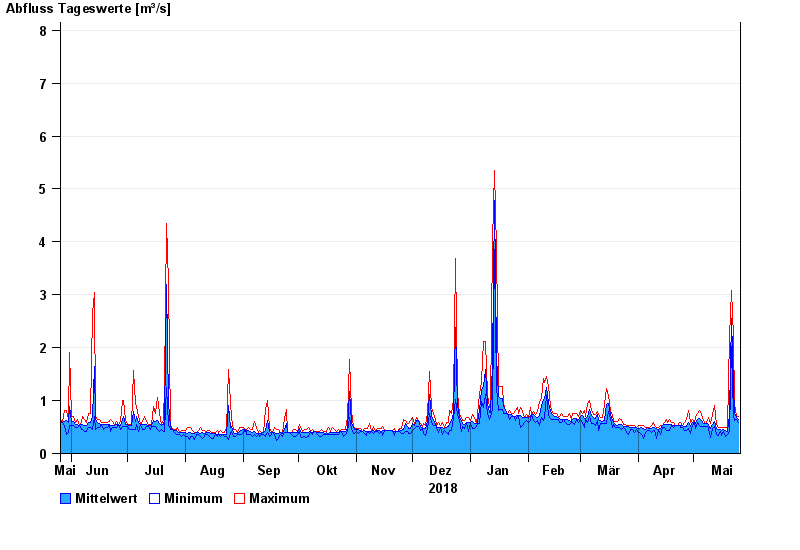
Chart of year Blumenthal / Ecknach
Discharge from 26.05.2018 to 25.05.2019
- 23.08.2005 Abfluss: 21,5 m³/s
- 02.06.2013 Abfluss: 20,4 m³/s
- 13.04.1994 Abfluss: 18,4 m³/s
- 15.02.1990 Abfluss: 17,5 m³/s
- 22.09.2000 Abfluss: 14,8 m³/s
| Date | Mean value [m³/s] | Maximum [m³/s] | Minimum [m³/s] |
|---|---|---|---|
| 25.05.2019 | 0.636 | 0.692 | 0.585 |
| 24.05.2019 | 0.685 | 0.692 | 0.635 |
| 23.05.2019 | 0.747 | 0.926 | 0.633 |
| 22.05.2019 | 1.25 | 2.22 | 0.721 |
| 21.05.2019 | 2.55 | 3.09 | 2.03 |
| 20.05.2019 | 0.738 | 2.21 | 0.408 |
| 19.05.2019 | 0.415 | 0.497 | 0.364 |
© Bayerisches Landesamt für Umwelt 2024