
- Start >
- Rivers >
- Discharge >
- Obere Donau >
- Blumenthal >
- Chart of year

Chart of year Blumenthal / Ecknach
Discharge from 09.07.2020 to 08.07.2021
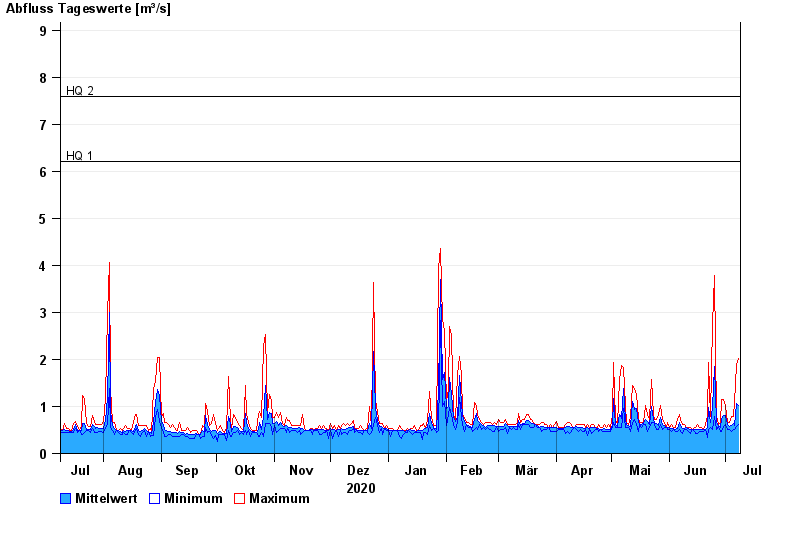
- HQ1 6,2 m³/s
- HQ2 7,6 m³/s
- HQ5 10 m³/s
- HQ10 13 m³/s
- HQ20 16,5 m³/s
- HQ50 21 m³/s
- HQ100 25 m³/s
| Date | Mean value [m³/s] | Maximum [m³/s] | Minimum [m³/s] |
|---|---|---|---|
| 08.07.2021 | 1.03 | 2.01 | 0.619 |
| 07.07.2021 | 1.07 | 1.89 | 0.569 |
| 06.07.2021 | 0.601 | 1.09 | 0.518 |
| 05.07.2021 | 0.648 | 0.785 | 0.518 |
| 04.07.2021 | 0.595 | 0.784 | 0.473 |
| 03.07.2021 | 0.571 | 0.668 | 0.517 |
| 02.07.2021 | 0.619 | 0.667 | 0.517 |
© Bayerisches Landesamt für Umwelt 2024