
- Start >
- Rivers >
- Discharge >
- Obere Donau >
- Blumenthal >
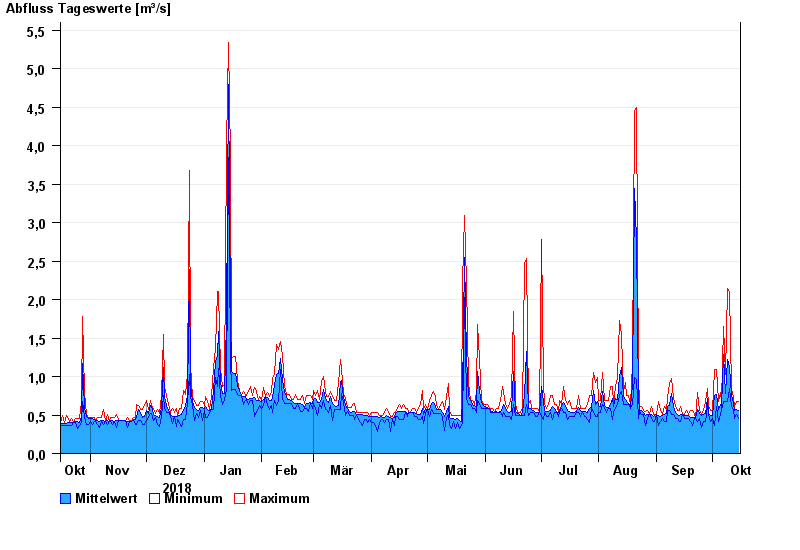
- Chart of year

Chart of year Blumenthal / Ecknach
Discharge from 16.10.2018 to 15.10.2019
| Date | Mean value [m³/s] | Maximum [m³/s] | Minimum [m³/s] |
|---|---|---|---|
| 15.10.2019 | 0.556 | 0.671 | 0.459 |
| 14.10.2019 | 0.574 | 0.671 | 0.504 |
| 13.10.2019 | 0.562 | 0.615 | 0.459 |
| 12.10.2019 | 0.646 | 0.731 | 0.56 |
| 11.10.2019 | 0.759 | 0.85 | 0.615 |
| 10.10.2019 | 1.13 | 2.09 | 0.85 |
| 09.10.2019 | 1.22 | 2.15 | 0.671 |
© Bayerisches Landesamt für Umwelt 2024