
- Start >
- Rivers >
- Discharge >
- Obere Donau >
- Blumenthal >
- Chart of year

Chart of year Blumenthal / Ecknach
Discharge from 27.06.2019 to 26.06.2020
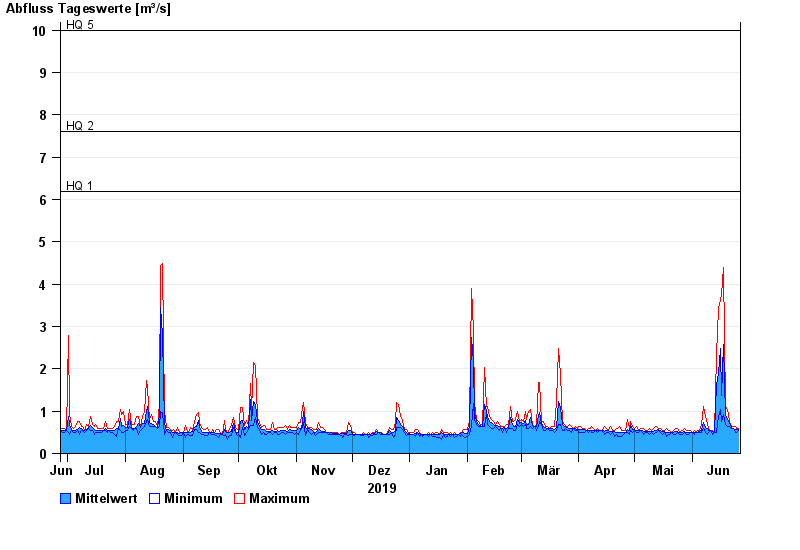
- HQ1 6,2 m³/s
- HQ2 7,6 m³/s
- HQ5 10 m³/s
- HQ10 13 m³/s
- HQ20 16,5 m³/s
- HQ50 21 m³/s
- HQ100 25 m³/s
| Date | Mean value [m³/s] | Maximum [m³/s] | Minimum [m³/s] |
|---|---|---|---|
| 26.06.2020 | 0.559 | 0.585 | 0.536 |
| 25.06.2020 | 0.567 | 0.585 | 0.487 |
| 24.06.2020 | 0.577 | 0.634 | 0.487 |
| 23.06.2020 | 0.586 | 0.634 | 0.585 |
| 22.06.2020 | 0.621 | 0.635 | 0.585 |
| 21.06.2020 | 0.707 | 0.75 | 0.635 |
| 20.06.2020 | 0.798 | 1.05 | 0.635 |
© Bayerisches Landesamt für Umwelt 2024