
- Start >
- Rivers >
- Discharge >
- Obere Donau >
- Blumenthal >
- Chart of year

Chart of year Blumenthal / Ecknach
Discharge from 18.09.2019 to 17.09.2020
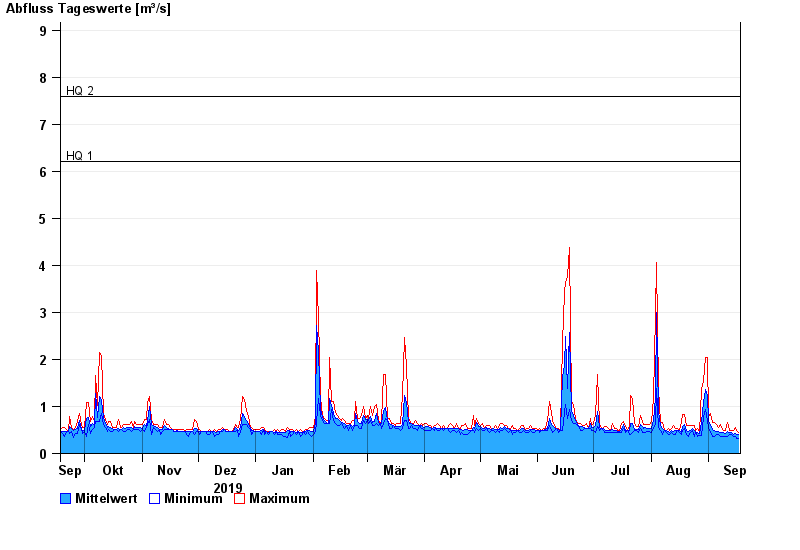
- HQ1 6,2 m³/s
- HQ2 7,6 m³/s
- HQ5 10 m³/s
- HQ10 13 m³/s
- HQ20 16,5 m³/s
- HQ50 21 m³/s
- HQ100 25 m³/s
| Date | Mean value [m³/s] | Maximum [m³/s] | Minimum [m³/s] |
|---|---|---|---|
| 17.09.2020 | 0.407 | 0.448 | 0.325 |
| 16.09.2020 | 0.406 | 0.493 | 0.325 |
| 15.09.2020 | 0.432 | 0.549 | 0.36 |
| 14.09.2020 | 0.397 | 0.494 | 0.361 |
| 13.09.2020 | 0.439 | 0.495 | 0.405 |
| 12.09.2020 | 0.438 | 0.495 | 0.407 |
| 11.09.2020 | 0.459 | 0.662 | 0.362 |
© Bayerisches Landesamt für Umwelt 2024