
- Start >
- Rivers >
- Discharge >
- Obere Donau >
- Blumenthal >
- Chart of year

Chart of year Blumenthal / Ecknach
Discharge from 18.06.2020 to 17.06.2021
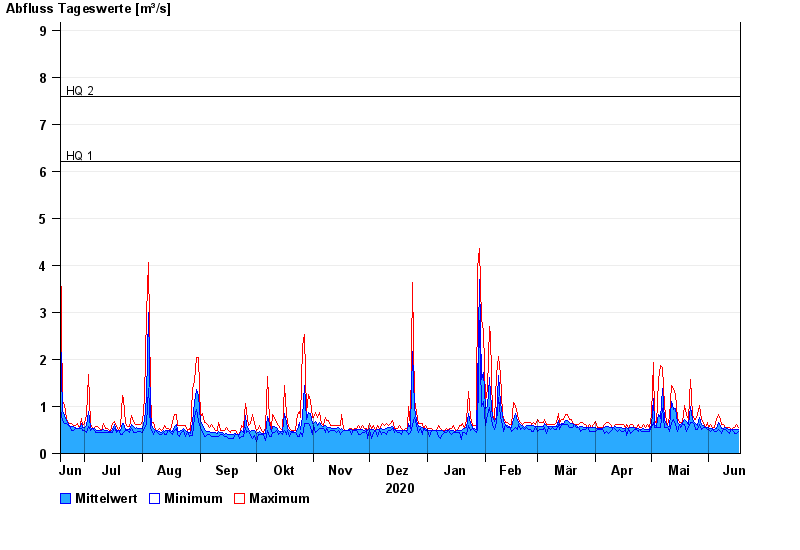
- HQ1 6,2 m³/s
- HQ2 7,6 m³/s
- HQ5 10 m³/s
- HQ10 13 m³/s
- HQ20 16,5 m³/s
- HQ50 21 m³/s
- HQ100 25 m³/s
| Date | Mean value [m³/s] | Maximum [m³/s] | Minimum [m³/s] |
|---|---|---|---|
| 17.06.2021 | 0.51 | 0.561 | 0.467 |
| 16.06.2021 | 0.505 | 0.61 | 0.424 |
| 15.06.2021 | 0.513 | 0.56 | 0.424 |
| 14.06.2021 | 0.508 | 0.559 | 0.465 |
| 13.06.2021 | 0.509 | 0.509 | 0.509 |
| 12.06.2021 | 0.514 | 0.558 | 0.423 |
| 11.06.2021 | 0.53 | 0.558 | 0.464 |
© Bayerisches Landesamt für Umwelt 2024