
- Start >
- Rivers >
- Discharge >
- Obere Donau >
- Blumenthal >
- Chart of year

Chart of year Blumenthal / Ecknach
Discharge from 18.06.2018 to 17.06.2019
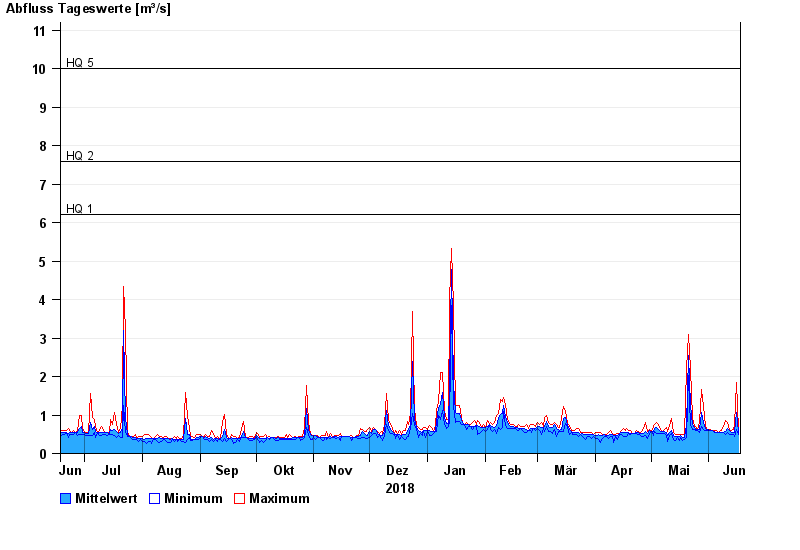
- HQ1 6,2 m³/s
- HQ2 7,6 m³/s
- HQ5 10 m³/s
- HQ10 13 m³/s
- HQ20 16,5 m³/s
- HQ50 21 m³/s
- HQ100 25 m³/s
| Date | Mean value [m³/s] | Maximum [m³/s] | Minimum [m³/s] |
|---|---|---|---|
| 17.06.2019 | 0.549 | 0.635 | 0.488 |
| 16.06.2019 | 1.06 | 1.85 | 0.635 |
| 15.06.2019 | 0.547 | 0.75 | 0.445 |
| 14.06.2019 | 0.539 | 0.635 | 0.487 |
| 13.06.2019 | 0.55 | 0.585 | 0.487 |
| 12.06.2019 | 0.589 | 0.635 | 0.487 |
| 11.06.2019 | 0.638 | 0.807 | 0.536 |
© Bayerisches Landesamt für Umwelt 2024