
- Start >
- Rivers >
- Discharge >
- Obere Donau >
- Blumenthal >
- Chart of year

Chart of year Blumenthal / Ecknach
Discharge from 16.10.2019 to 15.10.2020
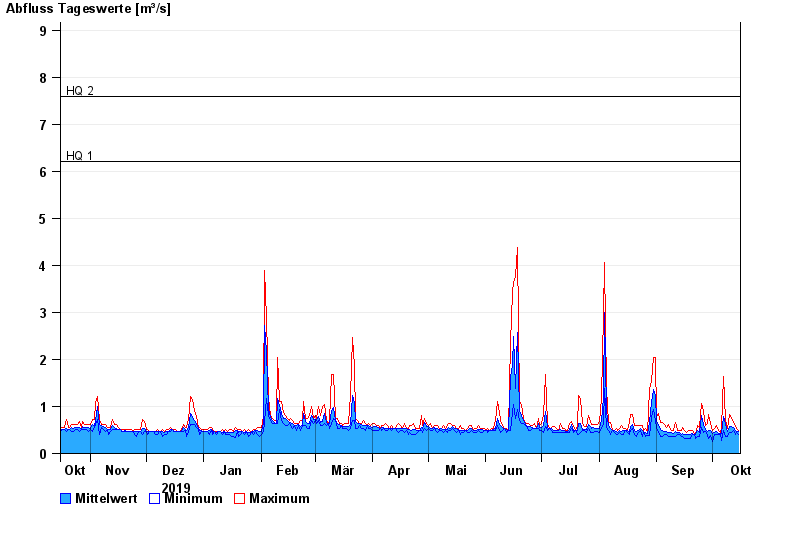
- HQ1 6,2 m³/s
- HQ2 7,6 m³/s
- HQ5 10 m³/s
- HQ10 13 m³/s
- HQ20 16,5 m³/s
- HQ50 21 m³/s
- HQ100 25 m³/s
| Date | Mean value [m³/s] | Maximum [m³/s] | Minimum [m³/s] |
|---|---|---|---|
| 15.10.2020 | 0.459 | 0.486 | 0.398 |
| 14.10.2020 | 0.471 | 0.541 | 0.442 |
| 13.10.2020 | 0.486 | 0.597 | 0.398 |
| 12.10.2020 | 0.556 | 0.652 | 0.486 |
| 11.10.2020 | 0.569 | 0.771 | 0.442 |
| 10.10.2020 | 0.565 | 0.83 | 0.442 |
| 09.10.2020 | 0.458 | 0.541 | 0.354 |
© Bayerisches Landesamt für Umwelt 2024