
- Start >
- Rivers >
- Discharge >
- Obere Donau >
- Blumenthal >
- Chart of year

Chart of year Blumenthal / Ecknach
Discharge from 02.10.2020 to 01.10.2021
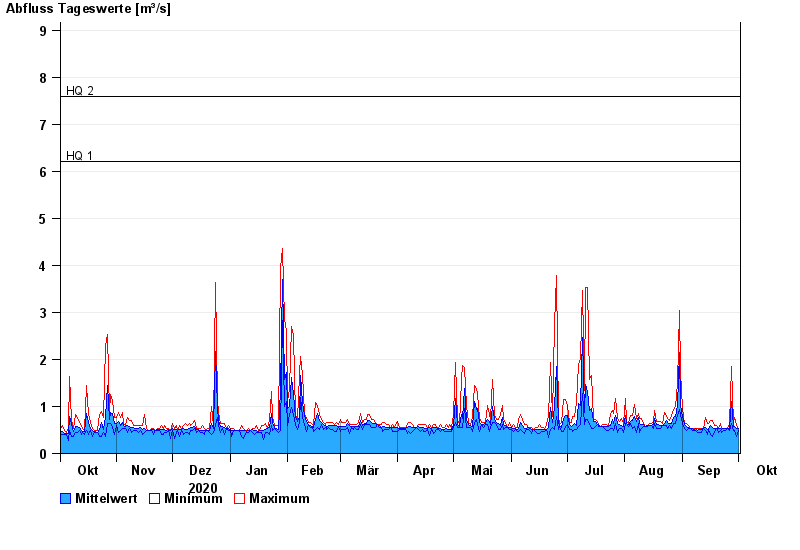
- HQ1 6,2 m³/s
- HQ2 7,6 m³/s
- HQ5 10 m³/s
- HQ10 13 m³/s
- HQ20 16,5 m³/s
- HQ50 21 m³/s
- HQ100 25 m³/s
| Date | Mean value [m³/s] | Maximum [m³/s] | Minimum [m³/s] |
|---|---|---|---|
| 01.10.2021 | 0.536 | 0.538 | 0.491 |
| 30.09.2021 | 0.527 | 0.586 | 0.365 |
| 29.09.2021 | 0.579 | 0.756 | 0.491 |
| 28.09.2021 | 0.573 | 0.642 | 0.491 |
| 27.09.2021 | 1.1 | 1.86 | 0.642 |
| 26.09.2021 | 0.527 | 0.642 | 0.491 |
| 25.09.2021 | 0.538 | 0.538 | 0.538 |
© Bayerisches Landesamt für Umwelt 2024