
- Start >
- Rivers >
- Discharge >
- Obere Donau >
- Blumenthal >
- Chart of year

Chart of year Blumenthal / Ecknach
Discharge from 01.01.2015 to 31.12.2015
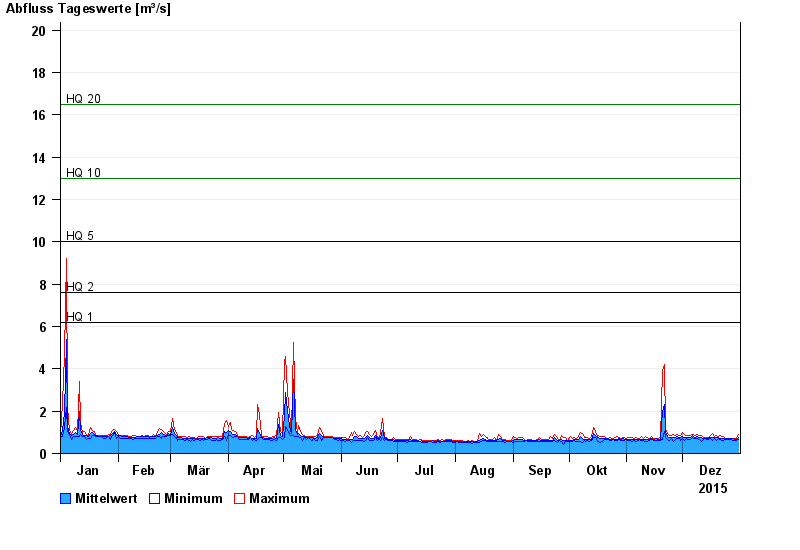
- HQ1 6,2 m³/s
- HQ2 7,6 m³/s
- HQ5 10 m³/s
- HQ10 13 m³/s
- HQ20 16,5 m³/s
- HQ50 21 m³/s
- HQ100 25 m³/s
| Date | Mean value [m³/s] | Maximum [m³/s] | Minimum [m³/s] |
|---|---|---|---|
| 31.12.2015 | 0.746 | 0.905 | 0.669 |
| 30.12.2015 | 0.671 | 0.727 | 0.619 |
| 29.12.2015 | 0.672 | 0.727 | 0.618 |
| 28.12.2015 | 0.698 | 0.727 | 0.618 |
| 27.12.2015 | 0.714 | 0.726 | 0.668 |
| 26.12.2015 | 0.709 | 0.726 | 0.668 |
| 25.12.2015 | 0.705 | 0.726 | 0.667 |
© Bayerisches Landesamt für Umwelt 2024