
- Start >
- Rivers >
- Discharge >
- Obere Donau >
- Blumenthal >
- Chart of year

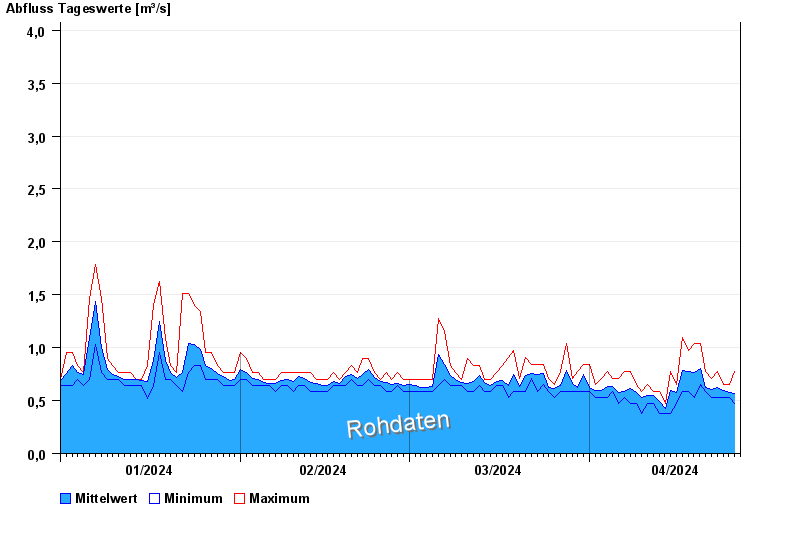
Chart of year Blumenthal / Ecknach
Discharge from 01.01.2024 to 26.04.2024
- HQ1 6,2 m³/s
- HQ2 7,6 m³/s
- HQ5 10 m³/s
- HQ10 13 m³/s
- HQ20 16,5 m³/s
- HQ50 21 m³/s
- HQ100 25 m³/s
| Date | Mean value [m³/s] | Maximum [m³/s] | Minimum [m³/s] |
|---|---|---|---|
| 26.04.2024 | 0.562 | 0.589 | 0.474 |
| 25.04.2024 | 0.573 | 0.65 | 0.531 |
| 24.04.2024 | 0.594 | 0.65 | 0.531 |
| 23.04.2024 | 0.619 | 0.778 | 0.531 |
| 22.04.2024 | 0.608 | 0.713 | 0.531 |
| 21.04.2024 | 0.624 | 0.778 | 0.589 |
| 20.04.2024 | 0.8 | 1.04 | 0.65 |
© Bayerisches Landesamt für Umwelt 2024