
- Start >
- Rivers >
- Discharge >
- Obere Donau >
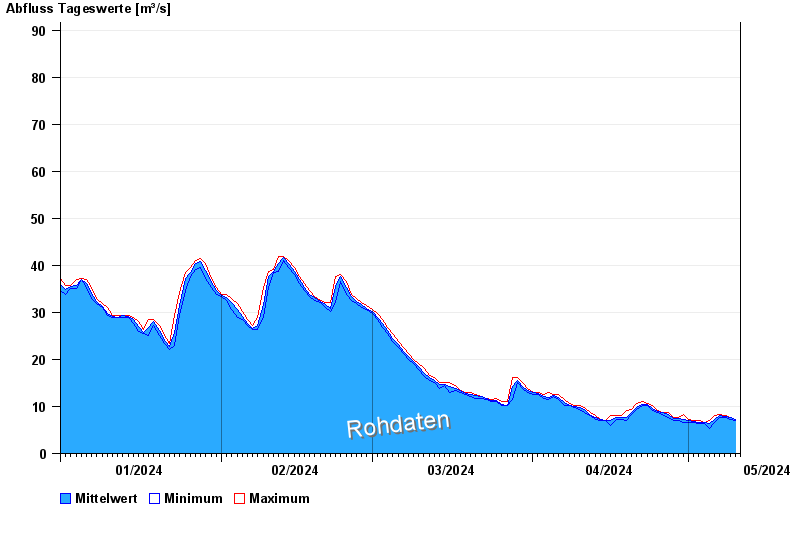
- Beilngries oberh. der Sulz >
- Chart of year

Chart of year Beilngries oberh. der Sulz / Altmühl
Discharge from 01.01.2024 to 10.05.2024
 Für diesen Pegel sind keine Jährlichkeiten hinterlegt.
| Date | Mean value [m³/s] | Maximum [m³/s] | Minimum [m³/s] |
|---|---|---|---|
| 10.05.2024 | 7.31 | 7.31 | 7.31 |
| 09.05.2024 | 7.6 | 7.64 | 7.31 |
| 08.05.2024 | 7.83 | 7.98 | 7.64 |
| 07.05.2024 | 7.99 | 8.34 | 7.64 |
| 06.05.2024 | 7.23 | 7.98 | 6.64 |
| 05.05.2024 | 6.35 | 6.96 | 5.41 |
| 04.05.2024 | 6.51 | 6.64 | 6.33 |
© Bayerisches Landesamt für Umwelt 2024