
- Start >
- Rivers >
- Discharge >
- Obere Donau >
- Bechhofen >
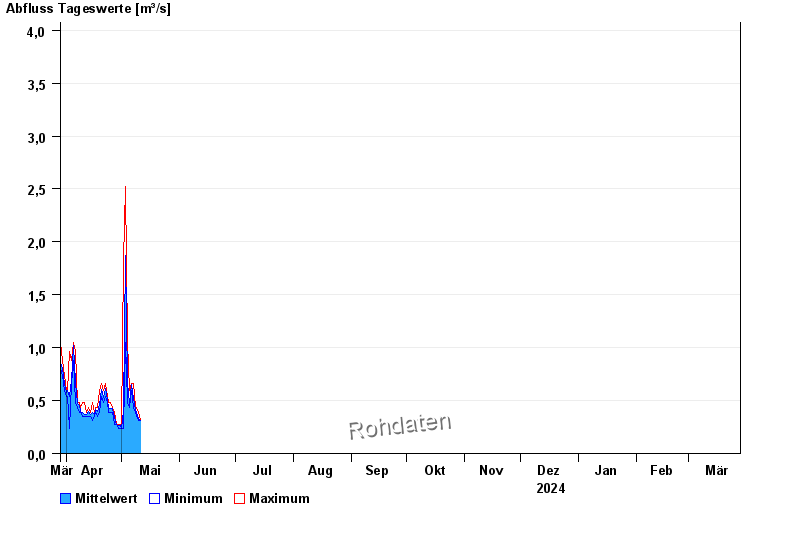
- Chart of year

Chart of year Bechhofen / Wieseth
Discharge from 29.03.2024 to 28.03.2025
- 21.12.1993 Abfluss: 49,7 m³/s
- 29.10.1998 Abfluss: 36,3 m³/s
- 09.03.2006 Abfluss: 33,6 m³/s
- 26.02.1997 Abfluss: 28,7 m³/s
- 22.02.1970 Abfluss: 27,8 m³/s
| Date | Mean value [m³/s] | Maximum [m³/s] | Minimum [m³/s] |
|---|---|---|---|
| 28.04.2024 | 0.272 | 0.272 | 0.272 |
| 27.04.2024 | 0.341 | 0.389 | 0.272 |
| 26.04.2024 | 0.422 | 0.436 | 0.389 |
| 25.04.2024 | 0.425 | 0.486 | 0.389 |
| 24.04.2024 | 0.433 | 0.486 | 0.389 |
| 23.04.2024 | 0.499 | 0.541 | 0.486 |
| 22.04.2024 | 0.617 | 0.663 | 0.541 |
© Bayerisches Landesamt für Umwelt 2024