
- Start >
- Rivers >
- Discharge >
- Obere Donau >
- Bächingen >
- Chart of year

Chart of year Bächingen / Brenz
Discharge from 01.01.2024 to 26.04.2024
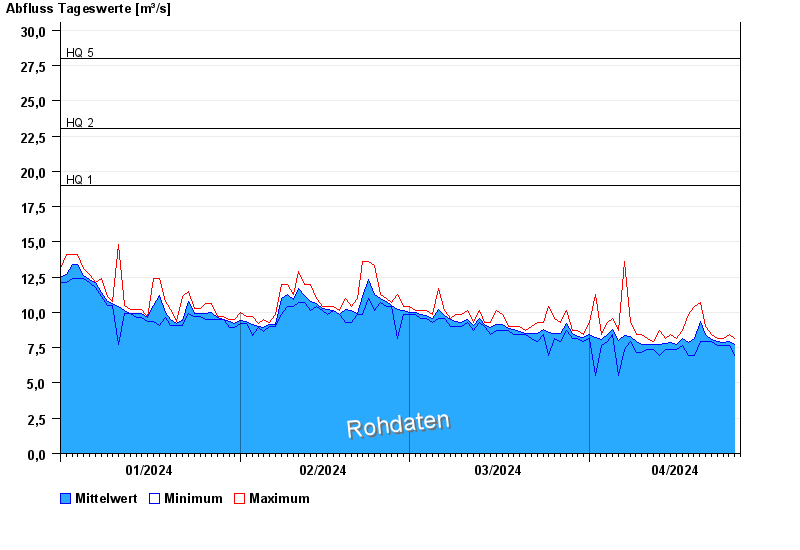
- HQ1 19 m³/s
- HQ2 23 m³/s
- HQ5 28 m³/s
- HQ10 32 m³/s
- HQ20 36 m³/s
- HQ50 41 m³/s
- HQ100 45 m³/s
| Date | Mean value [m³/s] | Maximum [m³/s] | Minimum [m³/s] |
|---|---|---|---|
| 26.04.2024 | 7.73 | 8.17 | 6.91 |
| 25.04.2024 | 7.94 | 8.43 | 7.65 |
| 24.04.2024 | 7.85 | 8.17 | 7.65 |
| 23.04.2024 | 7.92 | 8.17 | 7.65 |
| 22.04.2024 | 8.11 | 8.43 | 7.91 |
| 21.04.2024 | 8.41 | 8.98 | 7.91 |
| 20.04.2024 | 9.39 | 10.7 | 7.91 |
© Bayerisches Landesamt für Umwelt 2024