
- Start >
- Rivers >
- Discharge >
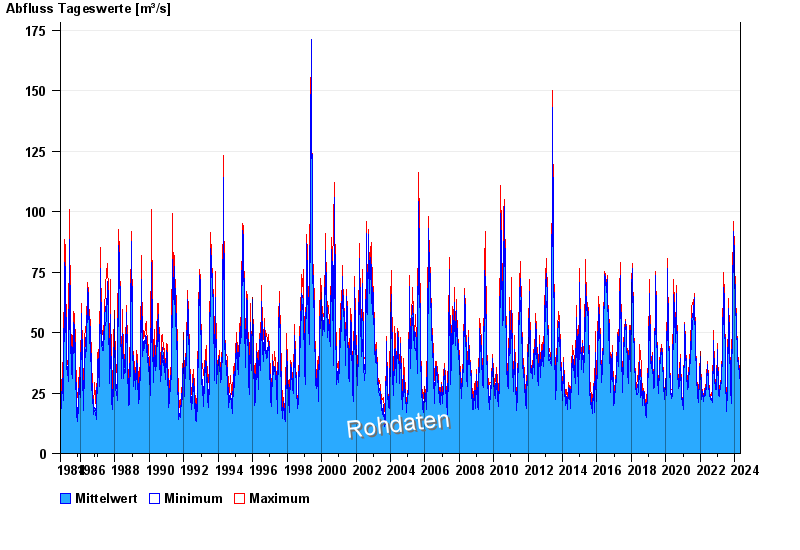
- Obere Donau >
- Ampermoching >
- Chart of total period

Chart of total period Ampermoching / Amper
Discharge from 01.11.1984 to 02.05.2024
| Date | Mean value [m³/s] | Maximum [m³/s] | Minimum [m³/s] |
|---|---|---|---|
| 02.05.2024 | 29.7 | 29.7 | 29.7 |
| 01.05.2024 | 29.5 | 30.2 | 28.8 |
| 30.04.2024 | 29.3 | 30.2 | 27.5 |
| 29.04.2024 | 29.2 | 30.2 | 28 |
| 28.04.2024 | 29.1 | 31.9 | 26.7 |
| 27.04.2024 | 29.6 | 30.2 | 29.3 |
| 26.04.2024 | 30.4 | 31.1 | 29.7 |
© Bayerisches Landesamt für Umwelt 2024