
- Start >
- Rivers >
- Discharge >
- Obere Donau >
- Amberg >
- Chart of year

Chart of year Amberg / Vils
Discharge from 28.04.2024 to 27.04.2025
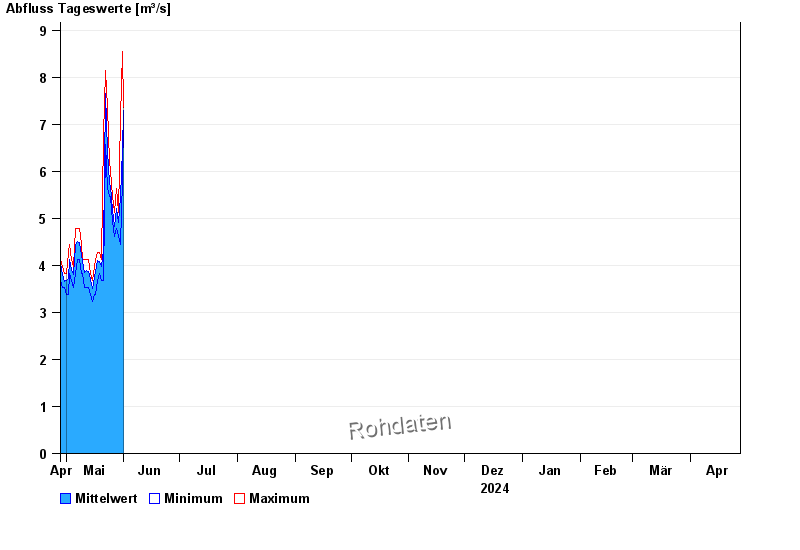
| Date | Mean value [m³/s] | Maximum [m³/s] | Minimum [m³/s] |
|---|---|---|---|
| 01.06.2024 | 7.14 | 7.35 | 6.96 |
| 31.05.2024 | 6.47 | 8.55 | 5.83 |
| 30.05.2024 | 5.46 | 7.15 | 4.44 |
| 29.05.2024 | 4.91 | 5.12 | 4.61 |
| 28.05.2024 | 5.21 | 5.64 | 4.78 |
| 27.05.2024 | 4.83 | 5.12 | 4.61 |
| 26.05.2024 | 5.17 | 5.47 | 4.94 |
© Bayerisches Landesamt für Umwelt 2024