
- Start >
- Rivers >
- Discharge >
- Obere Donau >
- Altendorf >
- Chart of year

Chart of year Altendorf / Gailach
Discharge from 15.08.2019 to 14.08.2020
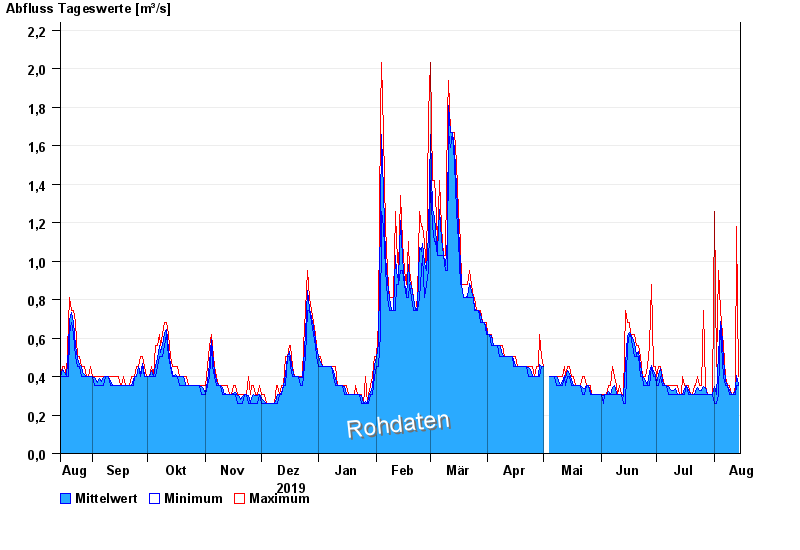
| Date | Mean value [m³/s] | Maximum [m³/s] | Minimum [m³/s] |
|---|---|---|---|
| 14.08.2020 | 0.357 | 0.4 | 0.351 |
| 13.08.2020 | 0.406 | 1.18 | 0.351 |
| 12.08.2020 | 0.331 | 0.351 | 0.305 |
| 11.08.2020 | 0.305 | 0.305 | 0.305 |
| 10.08.2020 | 0.305 | 0.305 | 0.305 |
| 09.08.2020 | 0.33 | 0.351 | 0.305 |
| 08.08.2020 | 0.351 | 0.351 | 0.351 |
© Bayerisches Landesamt für Umwelt 2024