
- Start >
- Rivers >
- Discharge >
- Obere Donau >
- Aha >
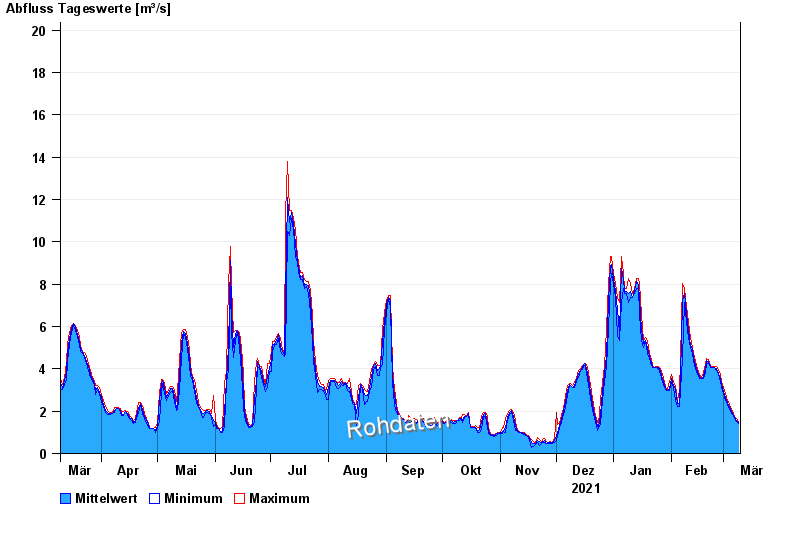
- Chart of year

Chart of year Aha / Altmühl
Discharge from 10.03.2021 to 09.03.2022
- 17.03.1988 Abfluss: 147 m³/s
- 14.04.1994 Abfluss: 123 m³/s
- 21.12.1993 Abfluss: 115 m³/s
- 03.03.1987 Abfluss: 97,6 m³/s
- 01.02.1982 Abfluss: 73,4 m³/s
| Date | Mean value [m³/s] | Maximum [m³/s] | Minimum [m³/s] |
|---|---|---|---|
| 09.03.2022 | 1.45 | 1.52 | 1.42 |
| 08.03.2022 | 1.54 | 1.64 | 1.49 |
| 07.03.2022 | 1.7 | 1.76 | 1.64 |
| 06.03.2022 | 1.84 | 1.9 | 1.8 |
| 05.03.2022 | 1.99 | 2.1 | 1.9 |
| 04.03.2022 | 2.19 | 2.3 | 2.1 |
| 03.03.2022 | 2.41 | 2.52 | 2.3 |
© Bayerisches Landesamt für Umwelt 2024