
- Start >
- Rivers >
- Discharge >
- Obere Donau >
- Aeschach >
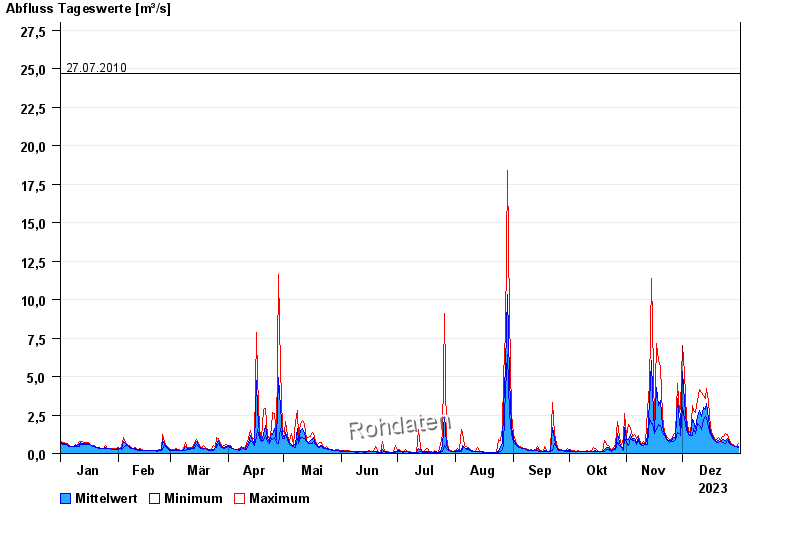
- Chart of year

Chart of year Aeschach / Oberreitnauer Ach
Discharge from 01.01.2023 to 31.12.2023
- 18.06.2010 Abfluss: 39,3 m³/s
- 31.05.2024 Abfluss: 36,1 m³/s
- 11.08.2002 Abfluss: 35,7 m³/s
- 02.06.2013 Abfluss: 29,2 m³/s
- 17.06.1991 Abfluss: 29,2 m³/s
| Date | Mean value [m³/s] | Maximum [m³/s] | Minimum [m³/s] |
|---|---|---|---|
| 31.12.2023 | 0.517 | 0.719 | 0.439 |
| 30.12.2023 | 0.484 | 0.516 | 0.464 |
| 29.12.2023 | 0.535 | 0.571 | 0.516 |
| 28.12.2023 | 0.582 | 0.628 | 0.543 |
| 27.12.2023 | 0.67 | 0.718 | 0.628 |
| 26.12.2023 | 0.797 | 0.912 | 0.718 |
| 25.12.2023 | 1.06 | 1.35 | 0.912 |
© Bayerisches Landesamt für Umwelt 2025