
- Start >
- Rivers >
- Discharge >
- Obere Donau >
- Aeschach >
- Chart of total period

Chart of total period Aeschach / Oberreitnauer Ach
Discharge from 01.11.2009 to 26.04.2024
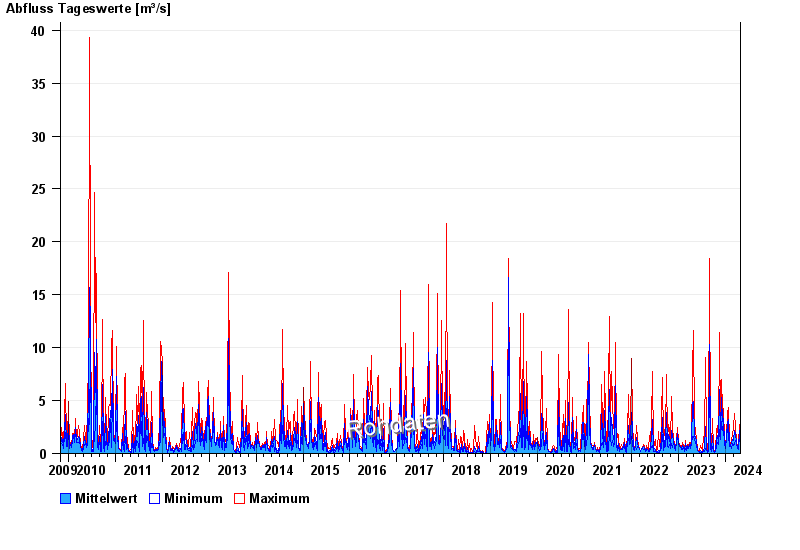
| Date | Mean value [m³/s] | Maximum [m³/s] | Minimum [m³/s] |
|---|---|---|---|
| 26.04.2024 | 0.56 | 0.585 | 0.53 |
| 25.04.2024 | 0.642 | 0.703 | 0.585 |
| 24.04.2024 | 0.763 | 0.827 | 0.703 |
| 23.04.2024 | 0.98 | 1.14 | 0.827 |
| 22.04.2024 | 1.43 | 1.7 | 1.18 |
| 21.04.2024 | 1.73 | 2.03 | 1.53 |
| 20.04.2024 | 2.08 | 2.73 | 1.62 |
© Bayerisches Landesamt für Umwelt 2024