
- Start >
- Rivers >
- Discharge >
- Obere Donau >
- Achsheim >
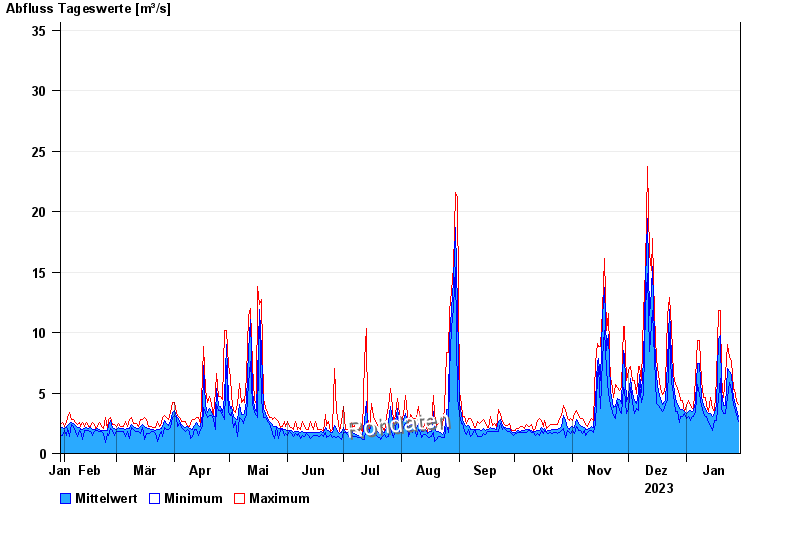
- Chart of year

Chart of year Achsheim / Schmutter
Discharge from 30.01.2023 to 29.01.2024
- 23.08.2005 Abfluss: 100 m³/s
- 14.04.1994 Abfluss: 64 m³/s
- 22.09.2000 Abfluss: 60,8 m³/s
- 12.08.2002 Abfluss: 60,3 m³/s
- 08.06.2002 Abfluss: 59,2 m³/s
| Date | Mean value [m³/s] | Maximum [m³/s] | Minimum [m³/s] |
|---|---|---|---|
| 29.01.2024 | 3.06 | 4.04 | 2.62 |
| 28.01.2024 | 3.6 | 4.27 | 3.19 |
| 27.01.2024 | 4.35 | 5.29 | 3.82 |
| 26.01.2024 | 4.58 | 5.29 | 4.04 |
| 25.01.2024 | 6.45 | 7.65 | 5.29 |
| 24.01.2024 | 6.75 | 7.97 | 5.85 |
| 23.01.2024 | 6.99 | 9.03 | 4.63 |
© Bayerisches Landesamt für Umwelt 2024